What dashboard development costs in India, the eight factors that move the price and how to keep the project on budget.
The Short Answer
Dashboard and BI projects at NexoraSoft typically start from about ₹60,000 and can go beyond ₹4,00,000 for large multi-source builds, and usually take 2 to 6 weeks depending on scope. The range is wide because a dashboard is not one product. It is a bundle of choices, and each one moves the price.
What Drives the Price
| Factor | Why it changes cost |
|---|---|
| Number of data sources | Each source needs a connector, testing and handling of its quirks. One MySQL database is simple, six systems with different formats are not. |
| Data quality | Duplicates, missing fields and inconsistent codes must be cleaned before numbers can be trusted. This is often the largest hidden cost. |
| Number of widgets and KPIs | Each KPI needs a definition, a query, a design and testing. Eight KPIs on one screen cost far less than forty across many screens. |
| Refresh rate | Numbers refreshed daily are cheap. Near-live feeds need more careful engineering and hosting. |
| Roles and permissions | More roles mean more templates, more testing and server-side checks. |
| Drill-down and actions | Buttons that open real screens or create records need integration with your product. |
| Mobile and wallboard layouts | Extra layouts to design and test. |
| Hosting and support | Server, backups, monitoring and changes after go-live are recurring costs. |
Build From Scratch or Start From a Product
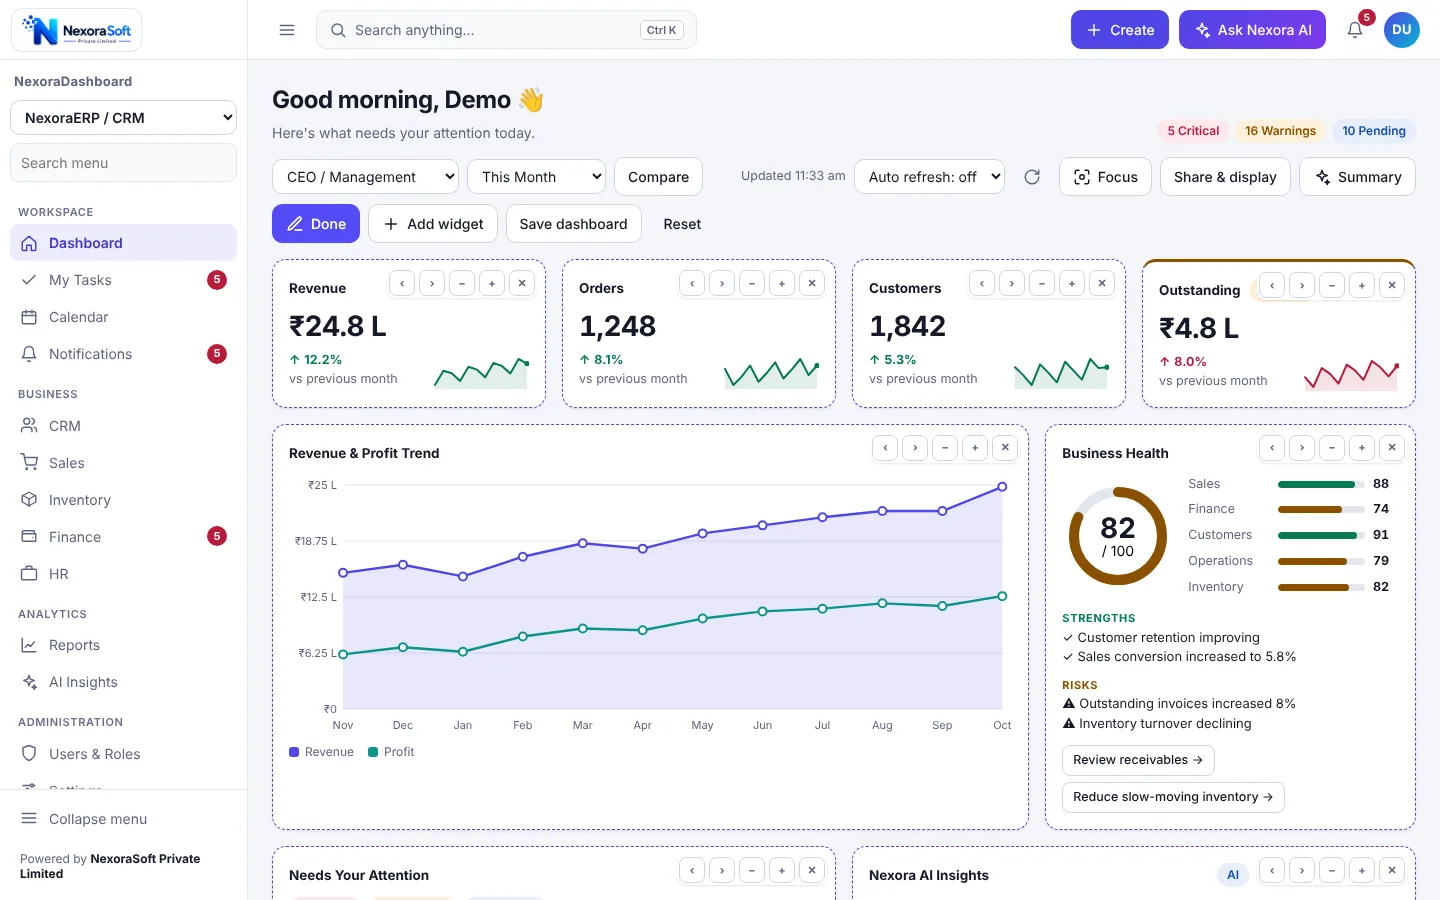
A fully custom dashboard gives you complete freedom and costs the most. Starting from a working engine such as NexoraDashboard means the layout, builder, roles, attention list, themes and mobile layout already exist, so the budget goes into connecting your data and shaping widgets.
How to Keep the Cost Under Control
- Start with six to eight KPIs and add more after the first release.
- Agree each KPI definition in writing before development, so formulas do not change midway.
- Fix the scope per release and review a working version every week.
- Clean the top two or three data problems at the source instead of working around them in the dashboard.
- Choose refresh rates per widget instead of making everything live.
Ask for: a written list of KPIs, sources, roles and refresh rates in the quote. If a vendor quotes without asking about them, the number is a guess.
What Ongoing Cost to Expect
Plan for hosting, backups and a small monthly allowance for changes. New KPIs, new data sources and changed business rules arrive constantly, and a dashboard that cannot change is abandoned.
Next Step
Share your KPIs and data sources through our dashboard development services page and we will respond with a scoped quote, usually within 24 hours. Compare tools first in custom dashboard vs Power BI.
Dashboard Development ServicesBusiness Dashboard SoftwareCustom Dashboard vs Power BIBI Dashboard Guide
Get a Dashboard Quote for Your KPIs
Free consultation, no commitment. We usually reply within 24 hours.
Book a Free Demo +91 98115 51004