An executive dashboard should tell a business owner what needs a decision today. Here are the six blocks it needs, how to put exceptions above numbers and how to keep it useful on a phone.
The Monday 9 am Test
A useful executive dashboard passes one test: can the owner open it at 9 am on Monday and know within a minute whether the week needs an intervention? If the answer needs a phone call to finance or a spreadsheet from sales, the dashboard is decoration.
Most owner dashboards fail because they start from the data that is easy to pull. Start from the decisions instead. An owner decides where to push sales, who to chase for payment, which customer to call, what to buy and whom to hire. Each decision needs one or two numbers and a way to act on them.
Six Blocks an Executive Dashboard Needs
1. Money in
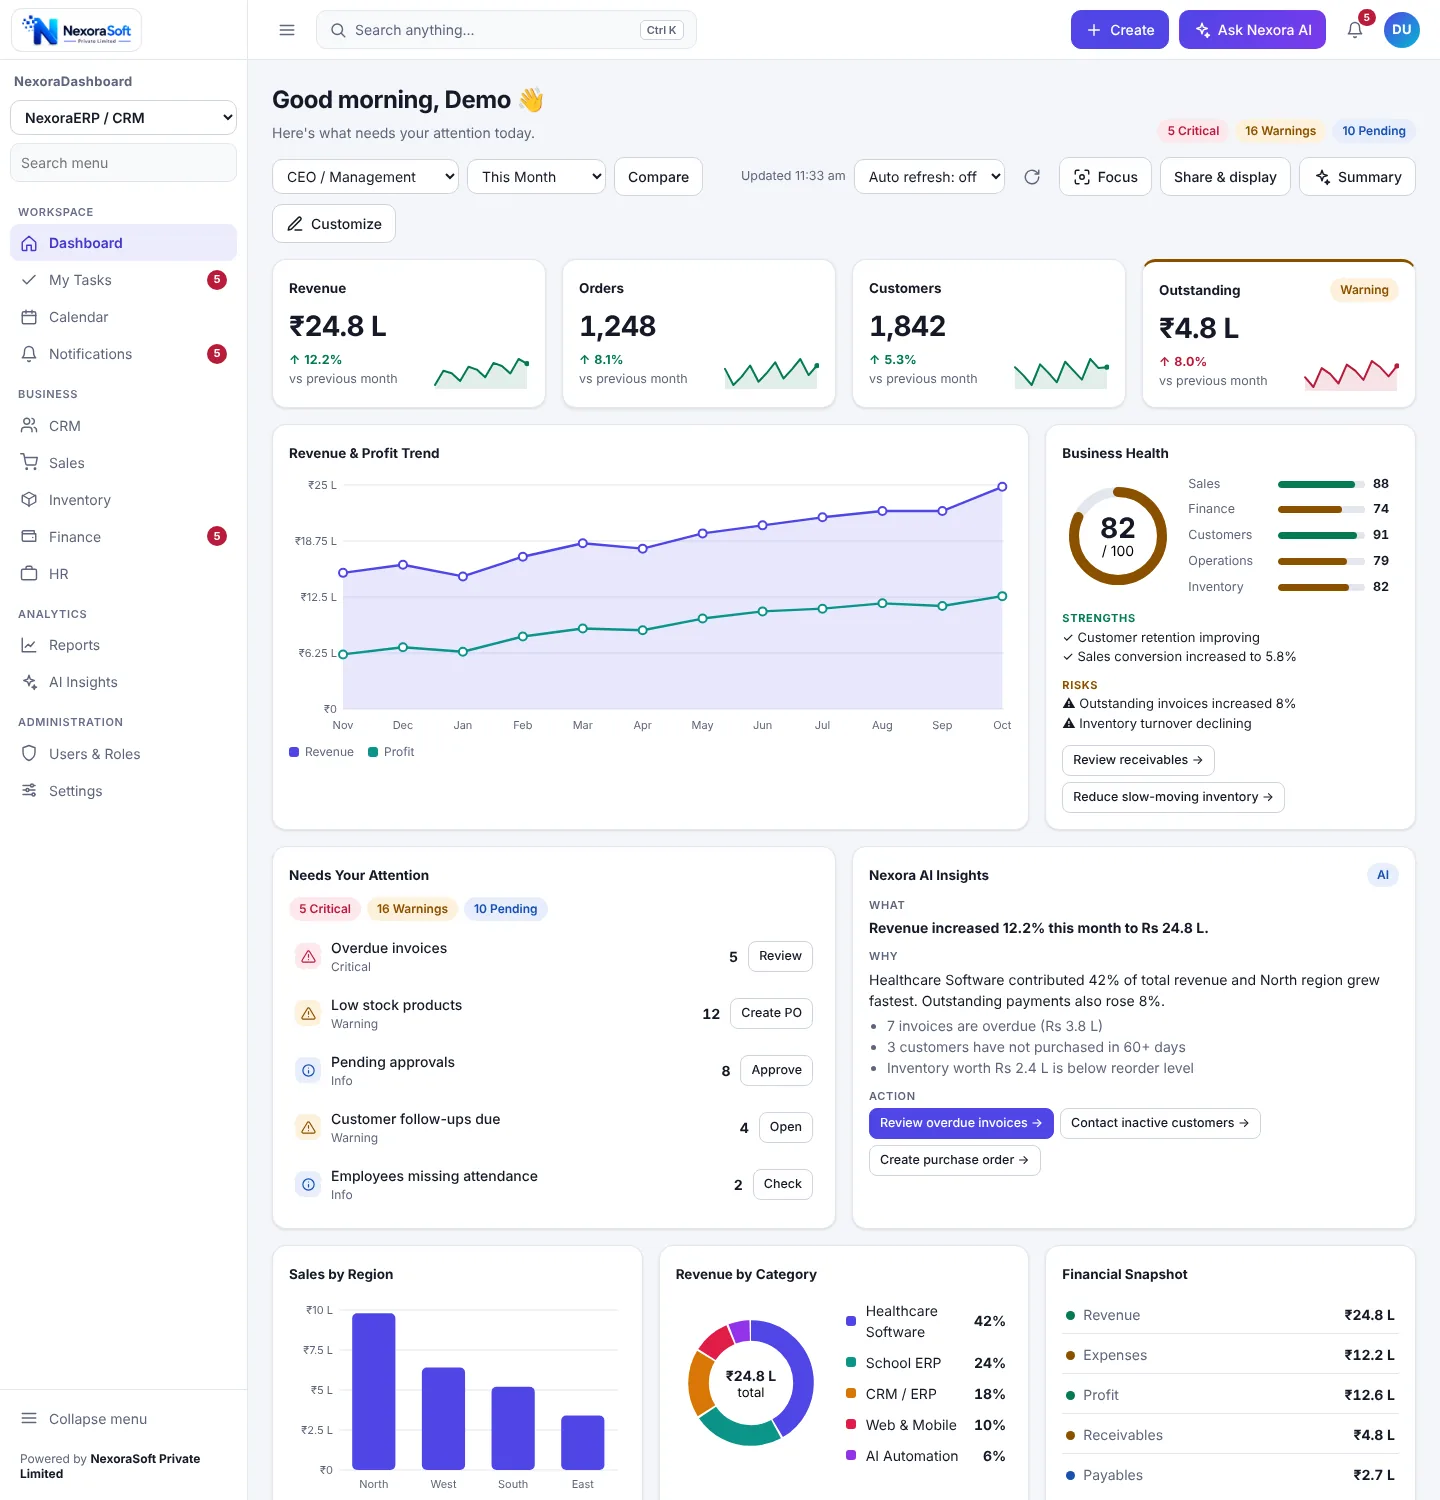
Revenue for the period against the previous period and against target, with a sparkline so the direction is obvious. Add profit only if your books are closed quickly enough for it to be trustworthy.
2. Money owed
Outstanding receivables and the count of overdue invoices. This is usually the fastest cash lever in a small business, so it deserves a place in the top row, not a report buried in finance.
3. Orders and pipeline
Orders received, sales funnel from lead to won deal and progress against the monthly target. The funnel shows where deals stall, which a revenue figure cannot.
4. Customers
New customers, repeat rate and customers who have not purchased for 90 days. A quiet customer is an early warning that arrives months before the revenue drop.
5. Operations and stock
One or two exception numbers such as low stock items or pending approvals. Operations rarely need a chart on an owner dashboard. They need a count and a button.
6. People
Attendance gaps and open tasks assigned to the owner. Keep it light; payroll detail belongs in the HR module.
Put Exceptions Above Numbers
The first thing below the KPI row should be a short list of items that need action today: five overdue invoices, twelve products below reorder level, eight approvals pending. Each row needs a button that opens the right screen. This turns the dashboard from something you read into something you work from.
Rule of thumb: six to eight numbers in the top row, five to seven exceptions below, and everything else one click away. If a number never changes a decision, remove it.
Add a Health Score Carefully
A single 0 to 100 score is handy for a quick read, but only if people understand what is inside it. Show the sub-scores for sales, finance, customers, operations and inventory next to it, with the strengths and risks in plain words. A score nobody can explain will be ignored the first time it is wrong.
Design for the Phone
Owners check numbers in cars, at events and on weekends. Test the dashboard on a phone first: stacked cards, large numbers, and a bottom navigation bar for the four things you do most. A privacy mode that masks amounts helps when the screen is shared in a meeting.
Refresh Rate Matters Less Than You Think
Cash and orders benefit from a refresh every few minutes. Profit, health score and customer metrics change daily at best. Pick the refresh rate per widget, and show the last updated time so nobody trusts a stale number.
Where to Start
Write down the ten numbers you look at every morning and the action each one triggers. That list is your first dashboard. Our NexoraDashboard gives you the layout, roles and attention list ready, so the work is connecting your data, and our ERP and CRM dashboard shows the exact blocks above running. For metric selection in more depth read the KPI dashboard design guide.
Business Dashboard SoftwareERP and CRM DashboardKPI Dashboard DesignDashboard Development Services
Build an Executive Dashboard for Your Business
Free consultation, no commitment. We usually reply within 24 hours.
Book a Free Demo +91 98115 51004