ERP and CRM Dashboard Software for Sales, Finance & Management
One screen for the CEO, sales head and finance manager: revenue, orders, customers, outstanding, funnel, targets and overdue invoices, with an attention list and a health score instead of five separate reports.
Sales funnel & targetsOverdue invoicesRole-based templatesBusiness health scoreSits on your ERP or CRM
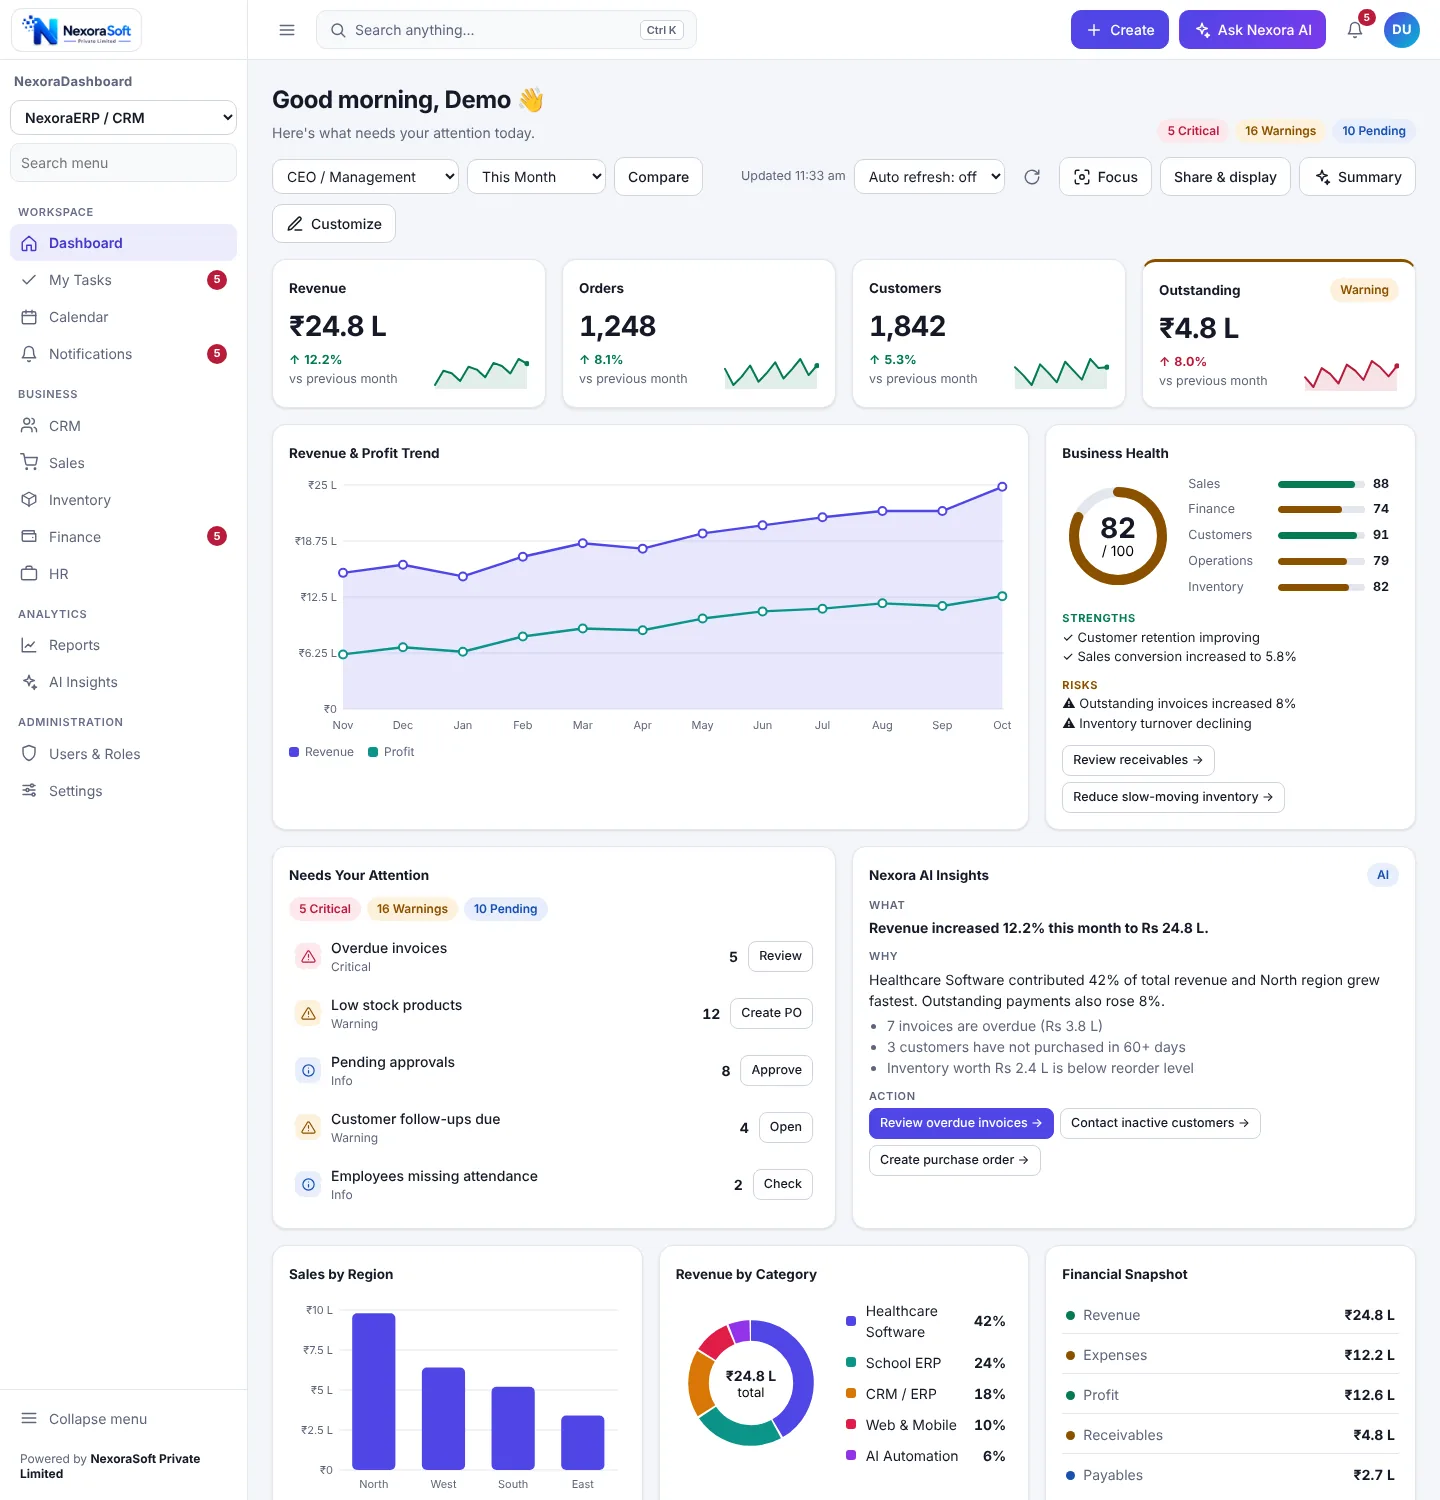
Most owners get their business numbers from a stack of reports that someone prepares at month end. By then the overdue invoice has aged and the quiet customer has moved on. An ERP and CRM dashboard shows the same numbers live and puts the exceptions at the top.
What the ERP and CRM Dashboard Shows
Each widget reads from your data, shows a trend or a status and can open the matching screen with one click.
| Widget | Type | What it shows |
|---|---|---|
| Revenue, Profit, Orders, Customers | KPI cards | Headline numbers with change against the previous period and a sparkline. |
| Outstanding, Expenses | KPI cards | Receivables and spend with amber or red status when they grow. |
| Revenue and Profit Trend | Line chart | Monthly revenue and profit for the selected range. |
| Sales by Region | Bar chart | Regional sales with drill-down. |
| Revenue by Category | Donut | Share of revenue by product or business line. |
| Sales Funnel | Funnel | Leads to won deals with drop-off at each stage. |
| Monthly Target | Progress | Achieved against target with days left. |
| Top Performers | Leaderboard | Salespeople ranked by achievement. |
| Overdue Invoices | Table | Sortable table with row actions to chase payment. |
| Financial Snapshot | Snapshot | Revenue, expenses, profit, receivables and payables in one card. |
Items That Need Action Today
Every row has a button that opens the related screen. Examples from the sample business:
Overdue invoices
Counts invoices past due with a Review button for finance.
Low stock products
Items under reorder level with a Create PO button.
Pending approvals
Discount, expense and purchase approvals waiting for a manager.
Customer follow-ups due
Follow-ups due today with an Open button for sales.
Employees missing attendance
Attendance gaps for HR to resolve.
Dashboards by Role
| Role or template | What they see |
|---|---|
| CEO / Management | Revenue, orders, customers, outstanding, trend, health score, attention list, insights, region, category, financial snapshot, activity, tasks and calendar. |
| Sales Manager | Orders, customers, monthly target, sales funnel, region, top performers, attention list, insights, tasks and calendar. |
| Finance Manager | Revenue, expenses, outstanding, overdue invoices and financial snapshot, with the attention list and insights. |
Beyond the Numbers
Management does not want to open five modules. The dashboard sits above CRM, sales, inventory, finance and HR and sends people into the right module only when something needs action.
- Create menu: New Customer, Invoice, Order, Task, Employee, Product
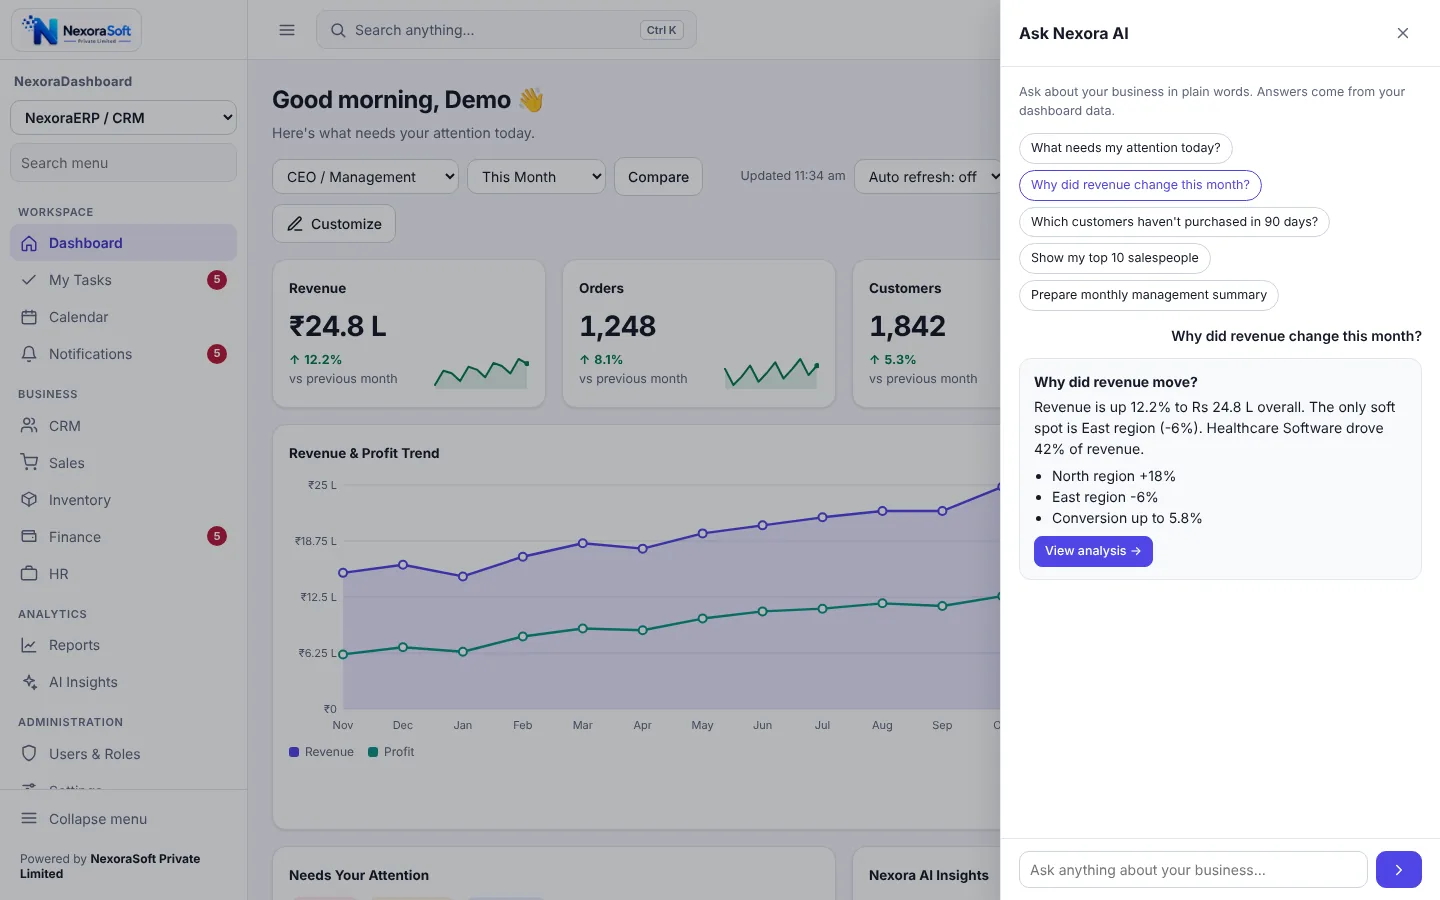
- Ask Nexora AI: why did revenue change, which customers have not purchased in 90 days, top 10 salespeople
- Saved layouts per manager and a management summary on one click
- CSV export and print to PDF for review meetings
See Your Business on One Screen
Share your ERP or CRM and the ten numbers you check every morning. We will show a dashboard built around them.
Frequently Asked Questions
It shows revenue, profit, orders, customers, outstanding payments and expenses, a revenue and profit trend, sales by region and category, the sales funnel, monthly target progress, top performers and overdue invoices, plus an attention list and business health score.
Yes. It reads from your database or APIs through providers written during setup, so you do not have to replace your ERP. It also works with NexoraSoft's own ERP and CRM.
Yes. Templates and permissions are per role. A sales manager sees orders, customers, target, funnel and leaderboard, while a finance manager sees revenue, expenses, outstanding and overdue invoices.
It is a 0 to 100 score built from areas such as sales, finance, customers, operations and inventory, with strengths, risks and suggested actions. The weights are configured to match how you judge your business.
Yes. Overdue invoices, low stock products, pending approvals, follow-ups due and employees missing attendance are typical attention items, each with a button that opens the related screen.
The dashboard shows target progress and a leaderboard of top performers. Detailed commission calculation lives in your CRM or ERP, and the dashboard reads the totals.
The Summary button prepares a management summary, and print or save as PDF is built in. Scheduled email summaries can be scoped as an extra.
Typically 2 to 4 weeks for the main widgets, depending on data quality and the number of roles.