A NOC wallboard is read from across the room. Here is what belongs on it, how to rank alarms, how to use colour and why data freshness must always be visible.
Design for a Glance From Across the Room
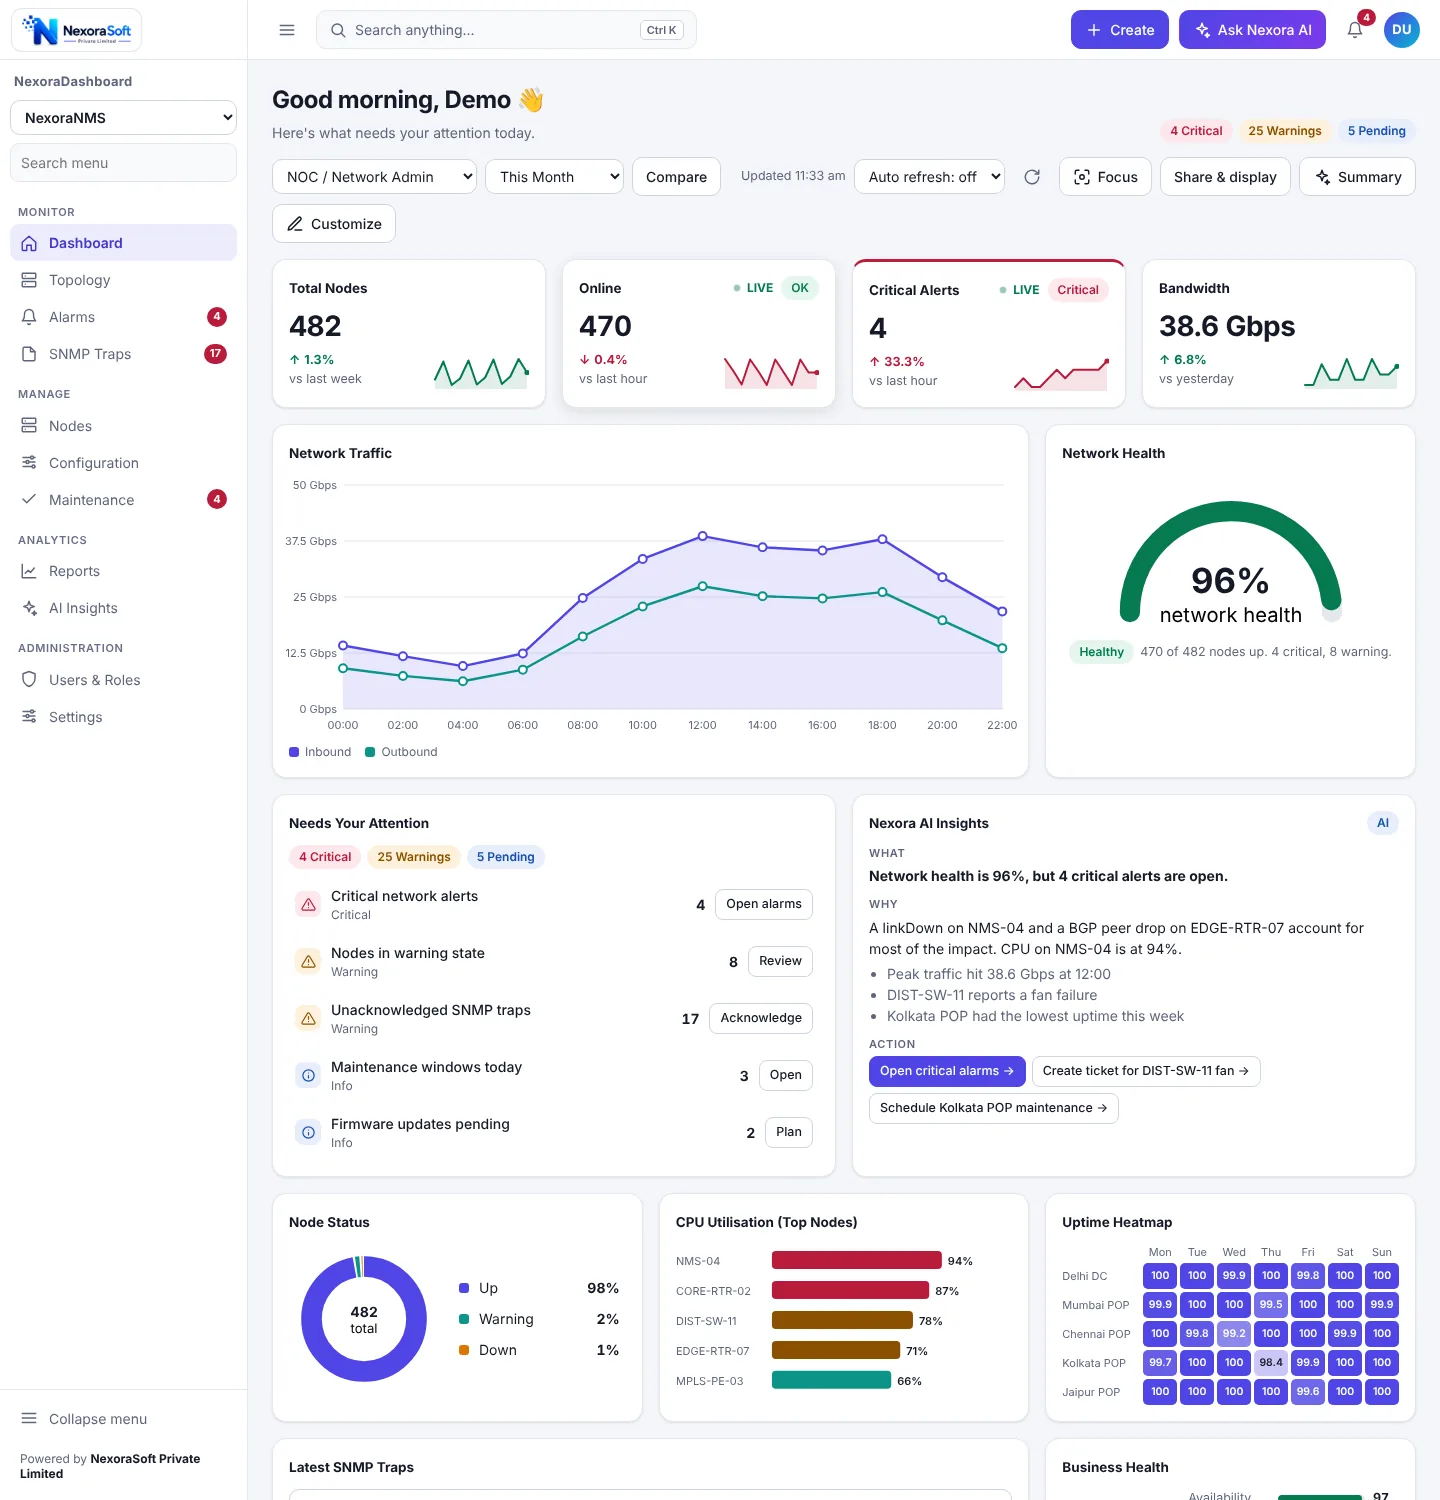
A NOC wallboard is read standing up, from several metres, while something else is going on. That rules out dense tables and tiny legends. Each block should answer one question: is the network healthy, what is broken, and is anything about to break.
What Belongs on the Wall
| Block | Question it answers |
|---|---|
| Network health | What share of nodes is up, with critical and warning counts? |
| Critical alerts | How many critical alarms are open right now? |
| Unacknowledged traps | Is anything waiting for an engineer? |
| Traffic, inbound and outbound | Is traffic normal for this hour of the day? |
| Uptime by site | Which POP or site has been weakest this week? |
| Top nodes by CPU | Which device is under strain before it fails? |
Rank Alarms, Do Not List Them
A list of every alarm trains engineers to ignore the screen. Show severity first, then age, and put acknowledgement status next to each row. An unacknowledged critical trap should be the loudest thing on the wall.
Use Colour Sparingly
If everything is red or amber, nothing is. Keep a calm default and reserve red for conditions that need action now. Use position and size for priority, and keep colour for status. Pick colours that remain distinguishable for colour-blind engineers.
Show Time and Freshness
Always show when the data was last updated. A frozen wallboard that still looks healthy is more dangerous than a blank one. Set the refresh interval to match how fast your polling runs; refreshing every few seconds adds load without adding information if devices are polled every minute.
Separate the Wallboard From the Workstation
The wall screen needs a small set of blocks. The engineer at the desk needs filters, drill-down and actions such as acknowledge, create ticket and open maintenance window. Build two layouts from the same data: a wallboard template and a working template.
Common mistake: copying the monitoring tool's main screen to the wall. Operators need detail, the wall needs priorities.
Measure the NOC, Not Only the Network
Add time to acknowledge and time to resolve for critical alarms once the basics are stable. They show whether the team is keeping up, which uptime alone cannot.
Related Reading and Tools
Our NOC dashboard software follows these rules with a wallboard template. The dashboard sits on top of an NMS such as NexoraNMS. For monitoring practice in general read network monitoring best practices, and for polling basics the SNMP monitoring guide.
NOC Dashboard SoftwareNetwork Monitoring SoftwareNetwork Monitoring Best PracticesSNMP Monitoring Guide
Build a NOC Dashboard for Your Network
Free consultation, no commitment. We usually reply within 24 hours.
Book a Free Demo +91 98115 51004