NOC Dashboard Software for Network Monitoring Teams
Give your network operations team one screen for node status, critical alarms, SNMP traps, bandwidth and uptime by site, with a wallboard layout for the wall screen and an attention list for the engineer on shift.
Node status & alarmsSNMP traps tableUptime heatmapWallboard modePairs with NexoraNMS
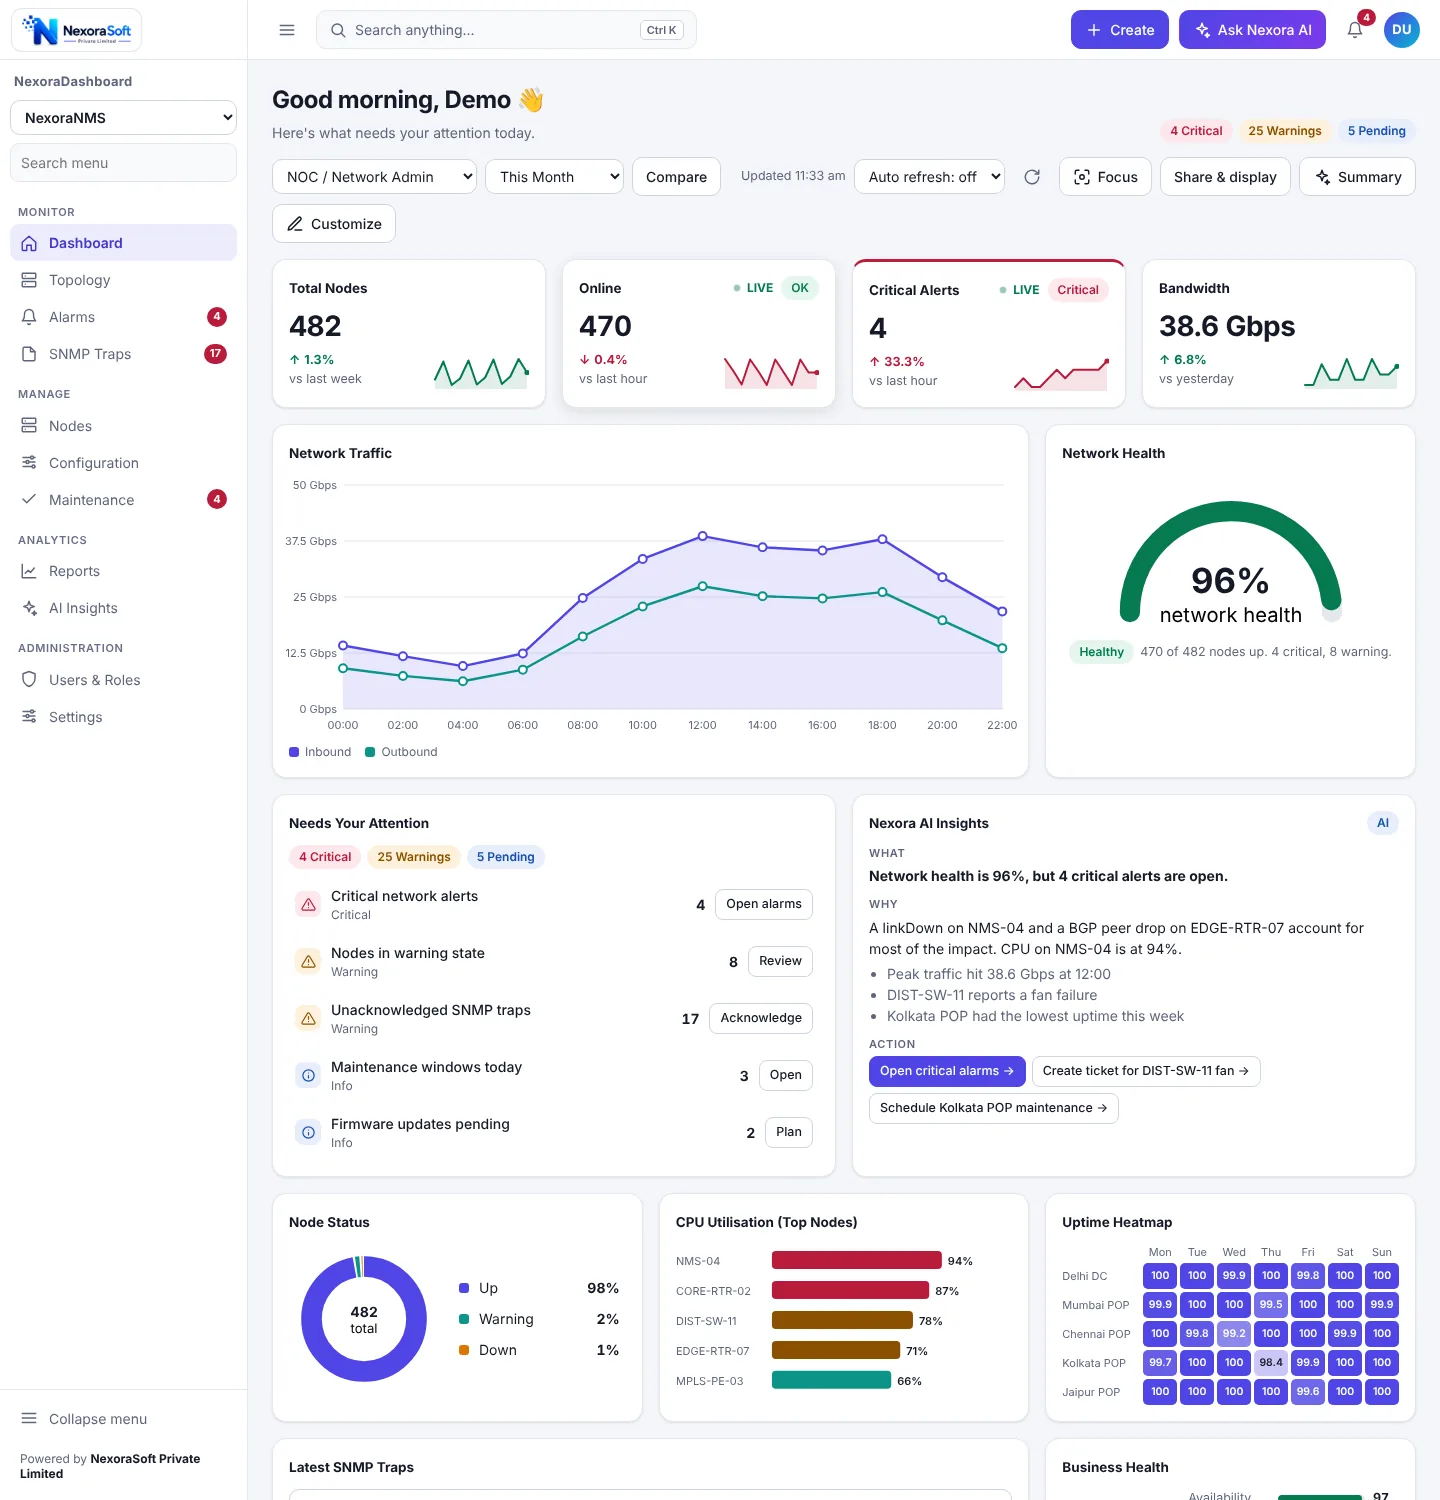
A NOC engineer should not need five tabs to know whether the network is healthy. The NOC dashboard puts the health score, the critical alarms and the unacknowledged traps in one place, and the wallboard version keeps the same data readable from across the room.
What the NOC Dashboard Shows
Each widget reads from your data, shows a trend or a status and can open the matching screen with one click.
| Widget | Type | What it shows |
|---|---|---|
| Total Nodes, Online | KPI cards | Inventory size and how many nodes are up, with change since the last hour or week. |
| Critical Alerts | KPI card | Open critical alarms, marked live and red when they rise. |
| Bandwidth | KPI card | Current traffic across the network against yesterday. |
| Network Traffic | Line chart | Inbound and outbound traffic across the day. |
| Network Health | Gauge | Share of nodes up with count of critical and warning nodes. |
| Node Status | Donut | Up, warning and down split. |
| CPU Utilisation (Top Nodes) | Bar chart | Busiest nodes ranked by CPU with warning colours. |
| Latest SNMP Traps | Table | Newest traps with severity and acknowledgement actions. |
| Uptime Heatmap | Heatmap | Availability by site and weekday. |
Alarms and Tasks for the Engineer on Shift
The attention list ranks what needs action, and each row opens the alarm, trap or window screen. Examples from the sample network:
Critical network alerts
Open alarms with an Open alarms button.
Nodes in warning state
Nodes with high CPU or interface issues with a Review button.
Unacknowledged SNMP traps
Traps waiting for an engineer with an Acknowledge button.
Maintenance windows today
Planned work due today with an Open button.
Firmware updates pending
Devices waiting for firmware with a Plan button.
Dashboards by Role
| Role or template | What they see |
|---|---|
| NOC / Network Admin | Node KPIs, traffic, health gauge, attention list, insights, node status, CPU, uptime heatmap, latest traps, tasks and activity. |
| Wallboard | Node KPIs, traffic, health gauge, latest traps and node status in a layout meant for a wall screen. |
Wallboard and Operations
A NOC dashboard is mostly read from a distance. The wallboard template keeps only what must be seen from across the room and drops the rest.
- Wallboard and presentation modes with the same data
- Auto refresh every 30 seconds, 1, 5 or 15 minutes
- Insights such as a linkDown on a core switch or a fan failure, with action buttons like Create ticket
- Command palette and Create menu for quick node, window and ticket actions
How It Connects to Your Data
The screenshots use sample data. For a live NOC dashboard we connect the widgets to the polling, trap and syslog data of NexoraNMS or your existing monitoring tool and wire buttons to the alarm and ticket screens. See also SNMP monitoring software and telecom monitoring.
Put Your NOC on One Screen
Share your device count, sites and monitoring tools. We will show a NOC dashboard built around them.
Frequently Asked Questions
A NOC dashboard shows total and online nodes, critical alerts, bandwidth, an inbound and outbound traffic chart, network health, node status, top CPU nodes, the latest SNMP traps and an uptime heatmap by site, with an attention list of alarms to act on.
No. The NMS polls devices and collects traps and syslog. The NOC dashboard is the management screen on top of it. Our NexoraNMS data feeds it, and it can also sit on top of other monitoring data.
Yes. A wallboard template and wallboard mode show the headline numbers, traffic, traps and node status in a layout meant for a wall-mounted screen.
Yes. The latest traps appear in a table, unacknowledged traps appear in the attention list with an Acknowledge button, and critical alerts open the alarm screen.
Yes. The uptime heatmap shows availability by site and day, so a weak POP is visible at a glance.
The Create menu includes New Maintenance Window, New Ticket, Add Node and Add Threshold Rule, and the attention list shows maintenance windows due today.
Storage views are covered by our NAS monitoring product and its multi-vendor NAS dashboard. NexoraDashboard can show a summary of both in one place.
Typically 2 to 4 weeks for the main widgets, depending on how monitoring data is stored and the number of sites.