KPI Dashboard Software with Trends, Thresholds & Alerts
Put the numbers that run your business on one screen: KPI cards with period comparison and sparklines, charts that drill down and an attention list that tells you which number needs action. Built into NexoraDashboard for ERP, CRM, hospital and NOC data.
KPI cards with sparklinesCompare with previous periodAmber and red thresholdsRole-based KPI setsMobile and dark mode
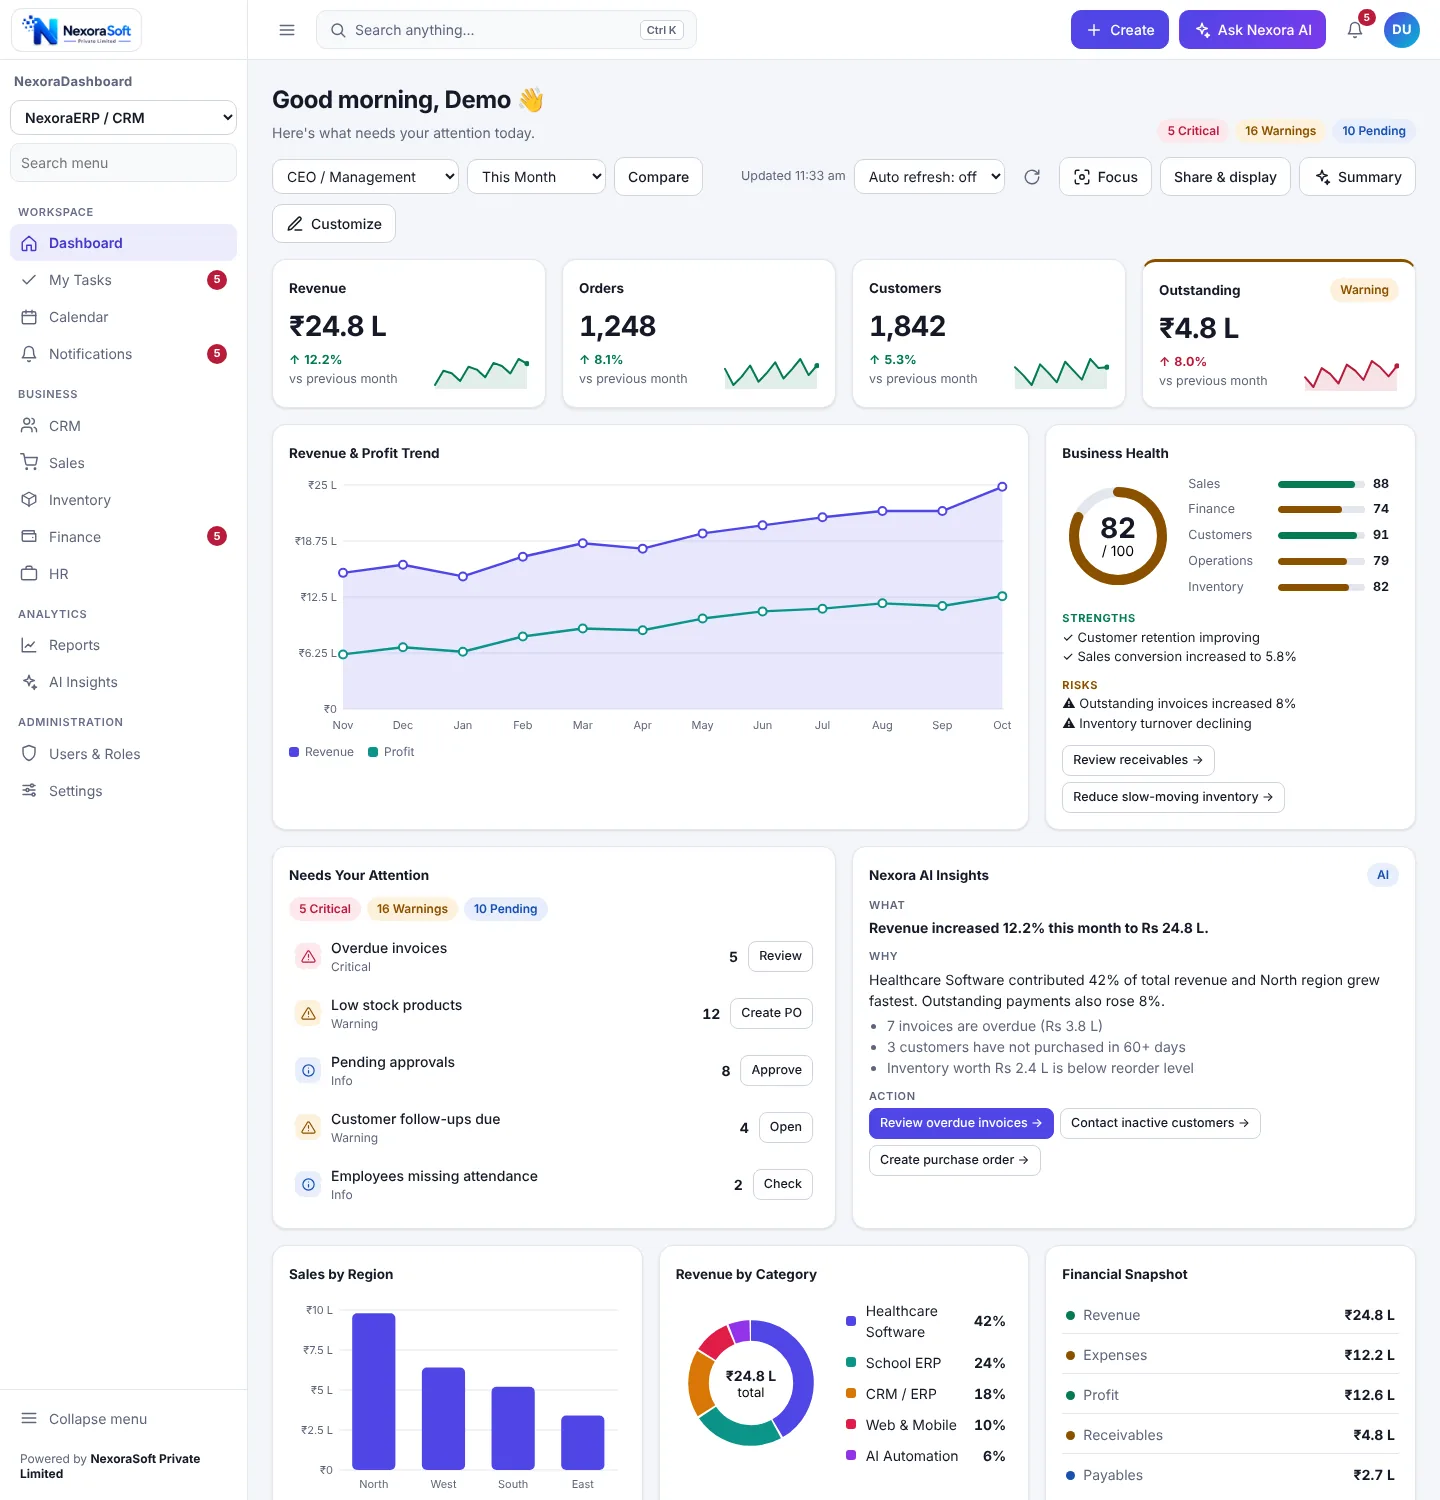
What Every KPI Card Tells You
A number alone is not a KPI. Each card answers four questions at a glance.
How much?
The current value for the selected date range, formatted for the metric: amounts in rupees, counts as whole numbers, percentages with one decimal.
Compared with what?
The change against the previous period with an up or down arrow, so a rising number is read in context.
Which way is it heading?
A sparkline shows the recent trend inside the card, which separates a one-off spike from a steady climb.
Does it need action?
The card turns amber or red when a threshold is crossed, and the same item appears in the attention list with an action button.
Ready KPI Sets for Three Kinds of Business
Each industry pack ships with KPIs, charts and role templates. Your own KPIs are added through configuration.
| Pack | KPI cards | Charts and tables around them |
|---|---|---|
| ERP and CRM | Revenue, orders, customers, outstanding, expenses, profit | Revenue and profit trend, sales by region, revenue by category, sales funnel, target progress, top performers, overdue invoices, financial snapshot |
| Hospital (NexoraHMS) | OPD visits, IPD admissions, revenue, pending bills, bed occupancy | Patient footfall, department-wise revenue, payment modes, admissions trend, lab status |
| NOC (NexoraNMS) | Total nodes, online nodes, critical alerts, bandwidth | Network traffic, node status, CPU load, SNMP traps, uptime heatmap, bandwidth gauge |
See the full pages: ERP and CRM dashboard, hospital dashboard, NOC dashboard.
Charts That Explain the Number
When a KPI moves, the next question is why. These widgets answer it on the same screen.
| Widget | Use it for |
|---|---|
| Line, area and combo charts | Trends over time, such as revenue against profit by month. |
| Bar chart with drill-down | Comparing regions, departments or products, then clicking into the one that stands out. |
| Donut chart | Share of a total, such as revenue by product category. |
| Gauge and progress | How far a number is from its target or its limit, such as bed occupancy or bandwidth use. |
| Funnel | Conversion through stages, such as lead to order. |
| Leaderboard and heatmap | Top performers and patterns by hour, day or node. |
| Tables with row actions | Sortable, filterable detail such as overdue invoices, with a button on each row. |
Date Range, Comparison and Refresh
Every KPI follows the filters in the header, so the whole screen tells one consistent story.
- Date range such as this month, with a Compare switch for the previous period
- Auto refresh every 30 seconds, 1, 5 or 15 minutes, or manual refresh
- Role selector in the header to preview what each manager sees
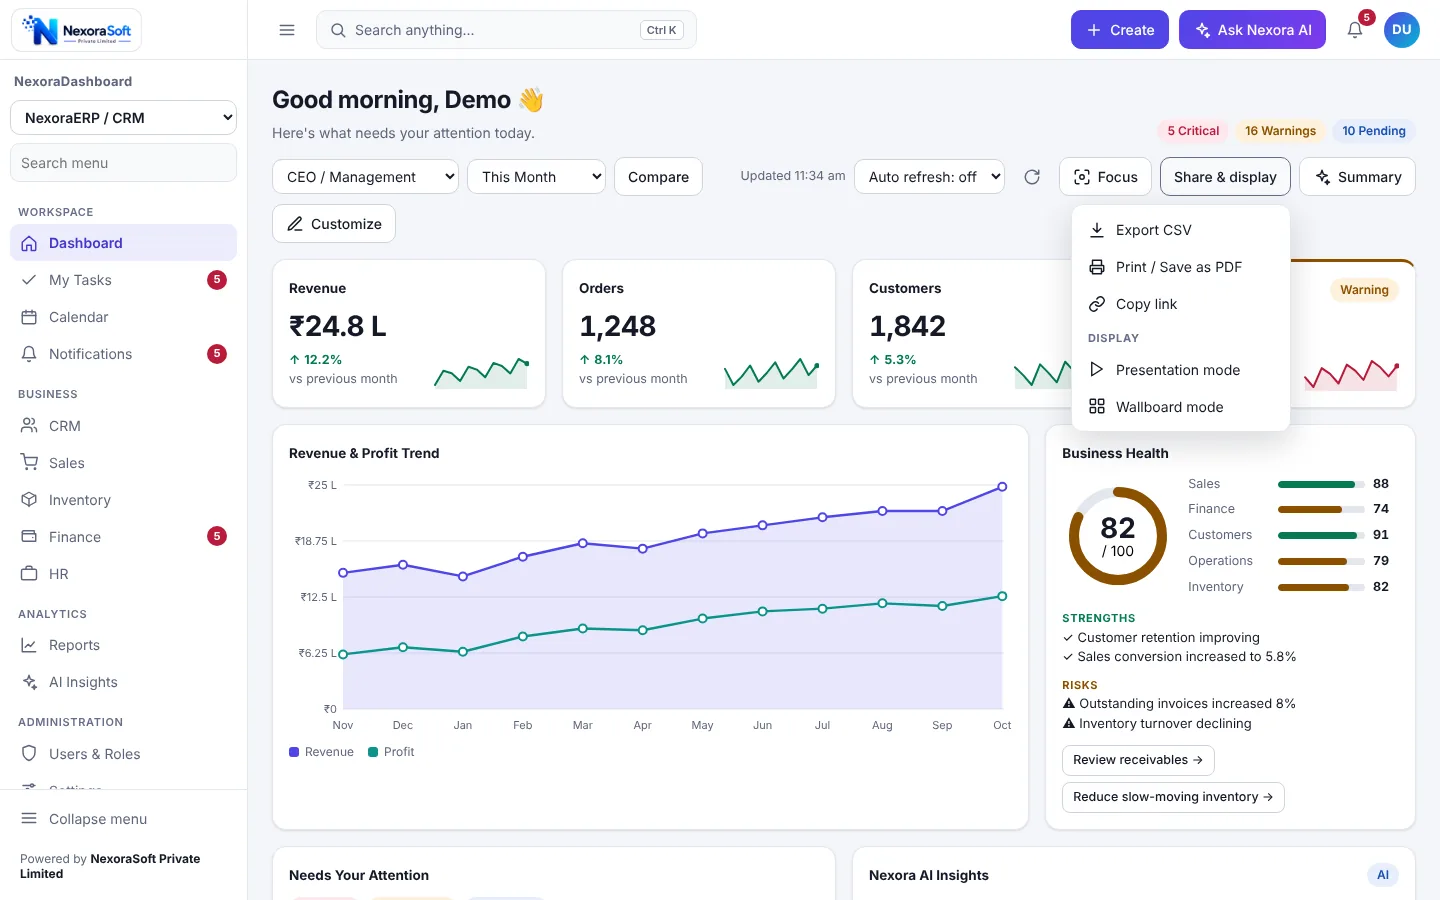
- CSV export of tables and print or save as PDF
- Privacy mode that masks amounts when the screen is shared
Which KPIs Belong on the First Screen
The most common mistake is too many numbers. We help you cut the list.
A good first screen has four to eight KPI cards, each owned by a person who can act on it. Start with what you check every morning, then add a number only when someone would change a decision because of it. Our guides cover the thinking: KPI dashboard design and the executive dashboard for business owners.
Book a KPI Workshop DemoSee All FeaturesCustom Dashboard Development
See Your KPIs on a Working Dashboard
Send the ten numbers you check every morning and the system they come from. We will show a working dashboard built around them.
Frequently Asked Questions
KPI dashboard software shows the handful of numbers that run a business or department on one screen, with the change against the previous period and a clear signal when a number needs attention. NexoraDashboard does this with KPI cards, trend charts and an attention list.
Each card shows the current value, the change against the previous period, a small sparkline of the trend and a status. A card turns amber or red when its threshold is crossed, so a problem stands out without reading every number.
Fewer than most people expect. Four to eight KPI cards on the first screen is a good limit, with charts and tables below for detail. Share the numbers you check every morning and we will help you cut the list to the ones that drive decisions.
Yes. A Compare switch compares the selected period with the previous one, and the date range can be changed from the header. KPI cards, charts and tables follow the selected range.
The ERP and CRM pack has revenue, orders, customers, outstanding, expenses and profit. The hospital pack has OPD visits, IPD admissions, revenue, pending bills and bed occupancy. The NOC pack has total nodes, online nodes, critical alerts and bandwidth. New KPIs are added through configuration.
From your own systems. Each widget reads from a provider on the server that queries your MySQL tables, your NexoraSoft product or another source. The screenshots on this page use sample data until your sources are connected.
Yes. Role templates decide which KPI cards and widgets each manager sees, and the server refuses data for a widget the role cannot view. Each person can also rearrange their own layout and save it.
Power BI suits analysts who build and explore their own reports. A KPI dashboard like this one is built for managers who need to know what to act on today, with alerts, tasks and role-based views included. Many companies run both.