Home › Products › NexoraUNMS › Data Centre 3D Rack Monitoring
NexoraUNMS · FeatureData Centre 3D Rack Monitoring Software
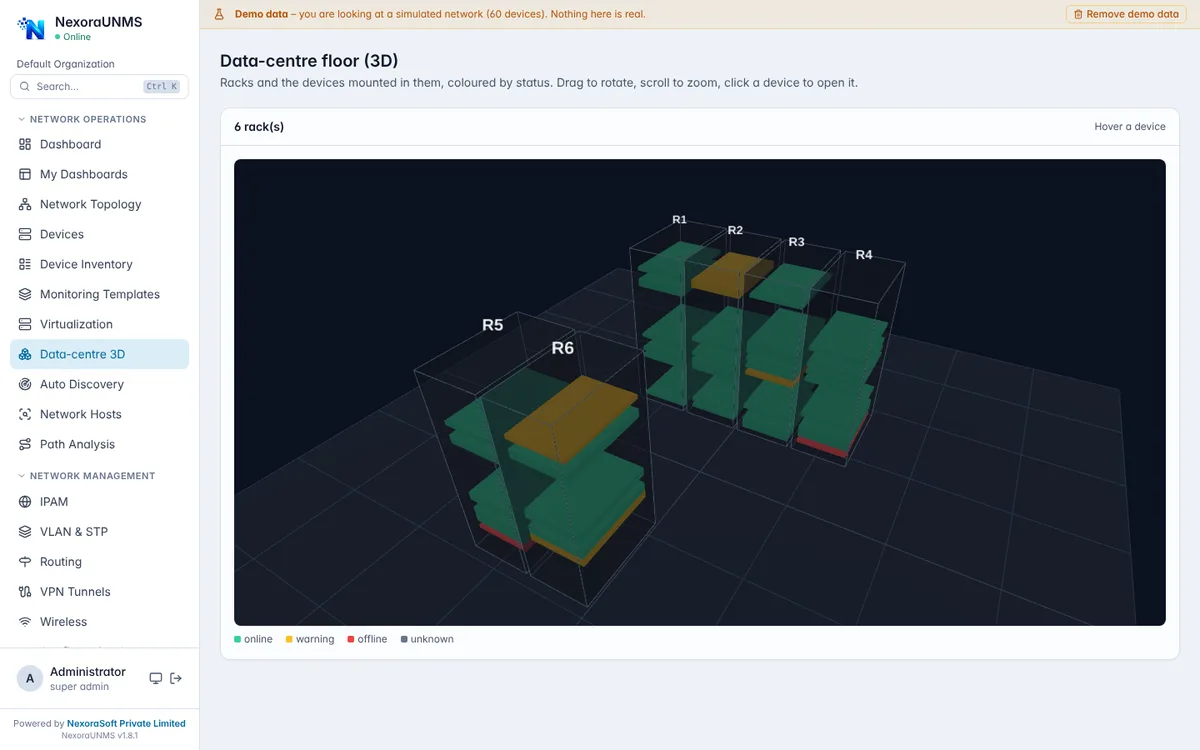
A server room is a set of racks, and a device that is down is easier to understand when you can see where it sits. NexoraUNMS draws a rotatable 3D floor of racks with each device at its rack unit, coloured by status. Click a device to open it.
3D rack floorRack and U assetsHardware sensorsUPS and powerStorage health
Real NexoraUNMS screens captured with built-in demo data (simulated network).
What Is Data Centre 3D Rack Monitoring?
A server room is a set of racks, and a device that is down is easier to understand when you can see where it sits. NexoraUNMS draws a rotatable 3D floor of racks with each device at its rack unit, coloured by status. Click a device to open it.
Around the floor sits the rest of data-centre monitoring: fans, power supplies and temperature sensors, UPS battery and runtime, RAID and disk health on supported storage, and a virtualization page that lists hosts and virtual machines from VMware vCenter, Proxmox VE, XenServer / XCP-ng and Hyper-V.
This capability is part of NexoraUNMS, so it shares one device inventory, one alert system and one login with monitoring, topology, configuration and reports.
What You Get
3D rack floor
Rotate and zoom racks with devices at their U positions, coloured online, warning, offline or unknown.
Rack and U assets
Rack and U position are set per device in Assets & Racks, and the 3D view is built from that data.
Hardware sensors
Fans, power supplies and temperature, with unsupported items hidden rather than shown as zero.
UPS and power
Battery charge, estimated runtime and load from UPS devices, with alerts when the battery is low.
Storage health
Synology RAID volume and disk health with drive temperature, and HPE Smart Array logical and physical drive status.
Virtualization
Hosts and VMs from vCenter, Proxmox VE and XenServer / XCP-ng; Hyper-V through a push script. A host that goes silent raises an alert.
How It Works
Add racks and devices
Record the rack and U position in Assets & Racks.
Open the 3D floor
Rotate, zoom and click a device.
Connect virtualization
Add a read-only account for vCenter, Proxmox or XenServer, or run the Hyper-V push script.
Alert and report
Hardware, UPS and host alerts flow into the same console and reports.
What to Know
The 3D floor is built from rack data and lays racks out automatically in rows; it is not a CAD floor plan. Proxmox, XenServer, Hyper-V and HPE Smart Array support was written from vendor documentation and tested against simulated responses, so we verify it on your hardware during the demo. VM performance counters and tape or SAN arrays are not covered.
Frequently Asked Questions
No. It shows racks in automatic rows with devices at their rack units, built from the rack and U data you enter.
VMware vCenter, Proxmox VE and XenServer / XCP-ng through their APIs, and Hyper-V through a PowerShell script on the host that pushes its VM list. The access is read-only.
UPS units over SNMP, Synology RAID and disk health, and HPE Smart Array drives. Other RAID controllers are not covered yet.
Yes. A host that is disconnected or powered off, or a Hyper-V host silent for 15 minutes, raises an alert.
Talk to Us About NexoraUNMS
Tell us how many devices and sites you run and what you need to see or control, and get a free live demo of NexoraUNMS. No commitment; we typically respond within 24 hours.