Home › Products › NexoraUNMS › Network Capacity Forecast & Anomaly Detection
NexoraUNMS · FeatureNetwork Capacity Forecast and Anomaly Detection
Capacity problems are cheap to fix a month early and expensive to fix during an outage. NexoraUNMS forecasts link and disk usage for 30, 60 and 90 days from your own history and shows which items will cross 80% or 100%, and when.
30/60/90-day forecastWhat-if growthTen statistical detectorsBehaviour baselinesFlap detection
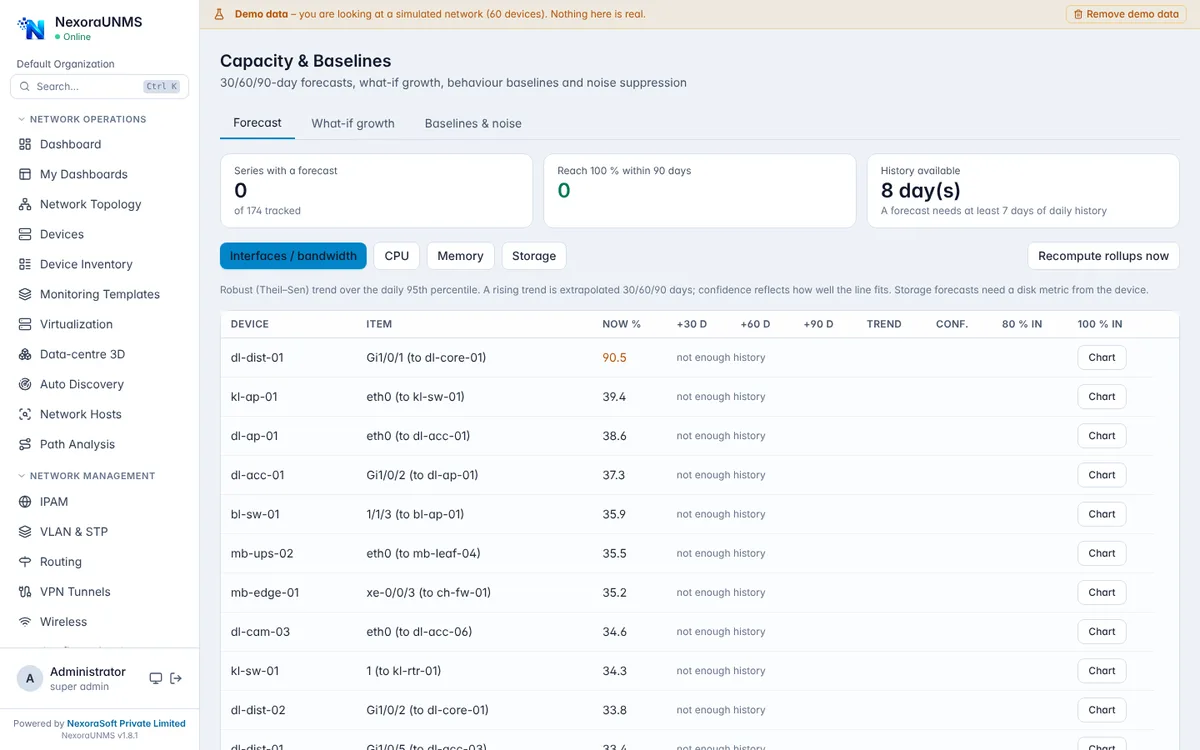
Real NexoraUNMS screens captured with built-in demo data (simulated network).
What Is Network Capacity Forecast & Anomaly Detection?
Capacity problems are cheap to fix a month early and expensive to fix during an outage. NexoraUNMS forecasts link and disk usage for 30, 60 and 90 days from your own history and shows which items will cross 80% or 100%, and when.
For unusual behaviour it runs ten classic statistical detectors per metric (CPU, memory, latency and interface utilisation) and reports an anomaly when four or more agree, alongside behaviour baselines learned per time of day and day of week.
This capability is part of NexoraUNMS, so it shares one device inventory, one alert system and one login with monitoring, topology, configuration and reports.
What You Get
30/60/90-day forecast
Per device and interface, with the date each item is expected to reach 80% or 100%.
What-if growth
Test a growth percentage and see which links and disks run out first.
Ten statistical detectors
Robust z-score, EWMA, CUSUM, two seasonal profiles, Holt forecast, rate of change, percentile band, trend residual and isolation forest vote on the newest hour.
Behaviour baselines
Median and MAD per time profile flag CPU, memory, latency and traffic that are unusual for that hour and weekday.
Flap detection
Interfaces and neighbours that keep changing state are flagged instead of buried in alerts.
Change-impact simulator
See which devices and services depend on a link or device before you take it down.
How It Works
Let history build
Baselines and forecasts need a few weeks of data.
Review the forecast
Sort by days to full and plan upgrades.
Watch anomalies
Open the Anomaly models card on a device page.
Tune noise
Adjust detection settings to match how your network behaves.
What to Know
These are classic statistical methods, not machine-learning models, and they need history, so results improve after a few weeks. Anomaly and baseline alerts show what is unusual, not necessarily what is wrong; use them with the Fault Advisor and topology.
Frequently Asked Questions
30, 60 and 90 days for links and disks, based on the history it has collected.
Robust z-score, EWMA, CUSUM, two seasonal profiles, Holt forecast, rate of change, percentile band, trend residual and isolation forest. Four or more agreeing is reported as an anomaly.
No. They are classic statistical detectors; the product does not claim trained machine-learning models.
A few weeks gives useful baselines and forecasts; a new device has no history before the day it was added.
Talk to Us About NexoraUNMS
Tell us how many devices and sites you run and what you need to see or control, and get a free live demo of NexoraUNMS. No commitment; we typically respond within 24 hours.