Home › Products › NexoraUNMS › Network Monitoring API & Integrations
NexoraUNMS · FeatureNetwork Monitoring API and Integrations
A network tool is only useful if it fits the tools around it. NexoraUNMS has a REST API with scoped tokens, a Prometheus scrape endpoint, 29 alert channel types, ticket connectors and a developer portal with a webhook test console.
Scoped API tokensPrometheus endpoint29 alert channel typesTicket connectorsVendor SDK packs
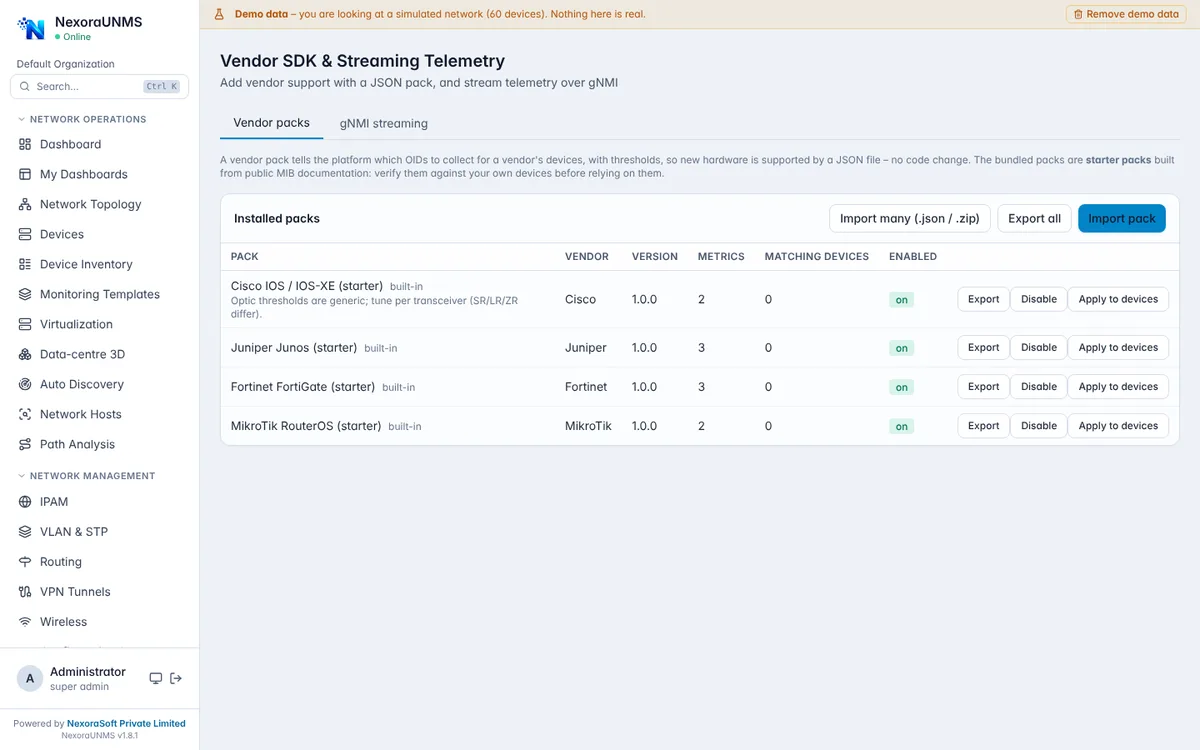
Real NexoraUNMS screens captured with built-in demo data (simulated network).
What Is Network Monitoring API & Integrations?
A network tool is only useful if it fits the tools around it. NexoraUNMS has a REST API with scoped tokens, a Prometheus scrape endpoint, 29 alert channel types, ticket connectors and a developer portal with a webhook test console.
For device support it has a vendor SDK: add a new vendor with a JSON pack, validate it against your devices, then apply it. MIB files can be loaded in bulk (many files or a zip) so you can bring in the MIBs you are licensed to use.
This capability is part of NexoraUNMS, so it shares one device inventory, one alert system and one login with monitoring, topology, configuration and reports.
What You Get
Scoped API tokens
Scopes, per-token rate limits and IP allow-lists, with an endpoint catalogue and examples in the developer portal.
Prometheus endpoint
GET /api/prometheus, authenticated with an API token as bearer, for Prometheus and Grafana.
29 alert channel types
E-mail, Slack, Teams, Telegram, PagerDuty, webhook, Opsgenie, Discord, Google Chat, Mattermost, ntfy, IRC and 17 more including ServiceNow, Jira, Zendesk, Freshdesk, Splunk, Datadog, Twilio and Webex.
Ticket connectors
New alerts can open tickets in ServiceNow, Jira, Zendesk and Freshdesk; ticket systems only receive new alerts.
Vendor SDK packs
Validate, import and export JSON device packs, up to 2,000 per organisation, with bulk import and four starter packs.
Bulk MIB import
Load many MIB files or a zip at once; dependencies are loaded in order and incomplete objects are flagged.
gNMI streaming telemetry
Subscribe to SAMPLE or ON_CHANGE telemetry over gRPC with TLS.
Single sign-on
SAML 2.0, OIDC and LDAP, plus HashiCorp Vault references for credentials.
How It Works
Create a token
Choose scopes, a rate limit and allowed IPs.
Connect a channel
Add the alert channel your team already uses.
Add a vendor pack
Paste JSON, validate it against your devices, then import.
Scrape or call
Point Prometheus or your scripts at the API.
What to Know
The 17 newer alert channels, Proxmox, XenServer and Hyper-V were written from vendor documentation and tested against simulated responses and request-shape tests, not against live accounts. gNMI is tested against a mock server only, so try one real device first. No MIB bundle or large vendor library is shipped; you load what you are licensed to use.
Frequently Asked Questions
It exposes a Prometheus scrape endpoint at /api/prometheus, authenticated with an API token as the bearer token.
29 channel types, including e-mail, Slack, Teams, Telegram, PagerDuty, Opsgenie, Discord, ServiceNow, Jira, Zendesk, Freshdesk, Splunk HEC, Datadog, Twilio SMS, Webex and a generic webhook.
Yes. Write a JSON vendor pack, validate it against your devices, import it and apply it. Bulk import takes many packs at once.
Yes. Tokens support scopes, per-token rate limits and IP allow-lists.
Talk to Us About NexoraUNMS
Tell us how many devices and sites you run and what you need to see or control, and get a free live demo of NexoraUNMS. No commitment; we typically respond within 24 hours.