A few products usually make most of your money. ABC analysis finds them so you can spend your attention and cash where it counts.
What ABC analysis is
ABC analysis ranks items by their annual consumption value (annual units × unit cost) and splits them into three classes. It is the Pareto principle applied to stock.
| Class | Share of items (typical) | Share of value (typical) | Control |
|---|---|---|---|
| A | About 10-20% | About 70-80% | Tight: frequent review and counts |
| B | About 30% | About 15-20% | Moderate |
| C | About 50%+ | About 5-10% | Simple, bulk ordering |
The percentages are conventions, not laws; set thresholds that suit your data.
Worked example
| Item | Annual value (₹) | Cumulative % | Class |
|---|---|---|---|
| Laptop 14" | 24,00,000 | 60% | A |
| Monitor 24" | 8,00,000 | 80% | A |
| Keyboard | 4,00,000 | 90% | B |
| Mouse | 2,40,000 | 96% | C |
| Cables | 1,60,000 | 100% | C |
Add XYZ for demand variability
XYZ looks at how steady demand is: X is steady, Y varies, Z is erratic. An A-Z item (high value, erratic demand) needs the most care; a C-X item can be automated.
What to do with each class
- A: count often, negotiate contracts, track daily, hold small safety stock
- B: review monthly
- C: order in bulk, count rarely
- Z items: keep forecast and safety stock under review
In NexoraIMS
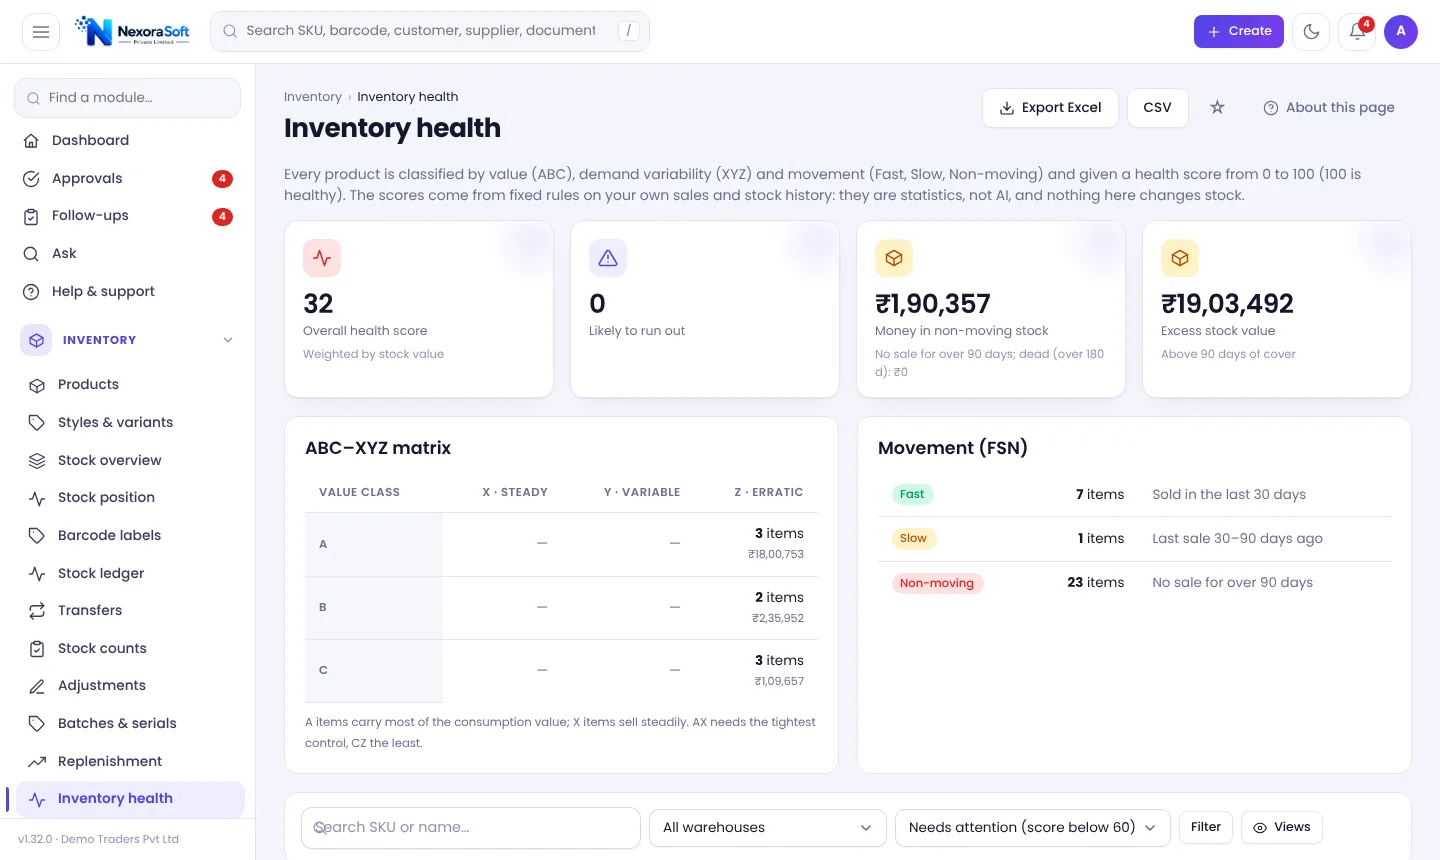
The Inventory health page assigns ABC value class, XYZ steadiness and Fast/Slow/Non-moving movement to every product, with a 0-100 health score and the reason. See inventory analytics software.
Related guides: Inventory Management Software in India (complete guide)
Reorder Point & Replenishment SoftwareInventory Analytics & ABC AnalysisStock Audit & Cycle Count SoftwareHow to Calculate Reorder PointInventory Turnover RatioDead Stock and Slow-Moving Inventory
See NexoraIMS in Action
Book a free live demo and see stock, purchasing, GST billing and reports run on your own products.
Book a Free Demo +91 98115 51004