Inventory turnover shows how many times you sell and replace your stock in a year. It is the quickest measure of whether your money is working or sleeping on shelves.
The formulas
Inventory turnover = Cost of goods sold ÷ Average inventory
Days of inventory = 365 ÷ Inventory turnover
Average inventory is usually (opening stock + closing stock) ÷ 2, valued at cost.
Worked example
| Item | Value (₹) |
|---|---|
| Cost of goods sold (year) | 1,20,00,000 |
| Opening stock | 28,00,000 |
| Closing stock | 32,00,000 |
| Average inventory | 30,00,000 |
| Turnover | 1,20,00,000 ÷ 30,00,000 = 4.0 times |
| Days of inventory | 365 ÷ 4 = about 91 days |
What is a good ratio?
It depends entirely on the business. Fresh produce turns in days; machinery in months. Compare against your own history and similar businesses, not a universal number.
Ways to improve it
- Identify and clear slow and non-moving stock
- Reorder by data (reorder point and forecast), not by habit
- Reduce supplier lead time or negotiate smaller, more frequent deliveries
- Use ABC classes to focus on high-value items
- Balance stock between warehouses
- Stop buying items that rarely sell
Pitfalls
- Do not chase turnover so hard that you stock out; service level matters too.
- Seasonal businesses should compare like periods.
- Use consistent valuation.
In NexoraIMS
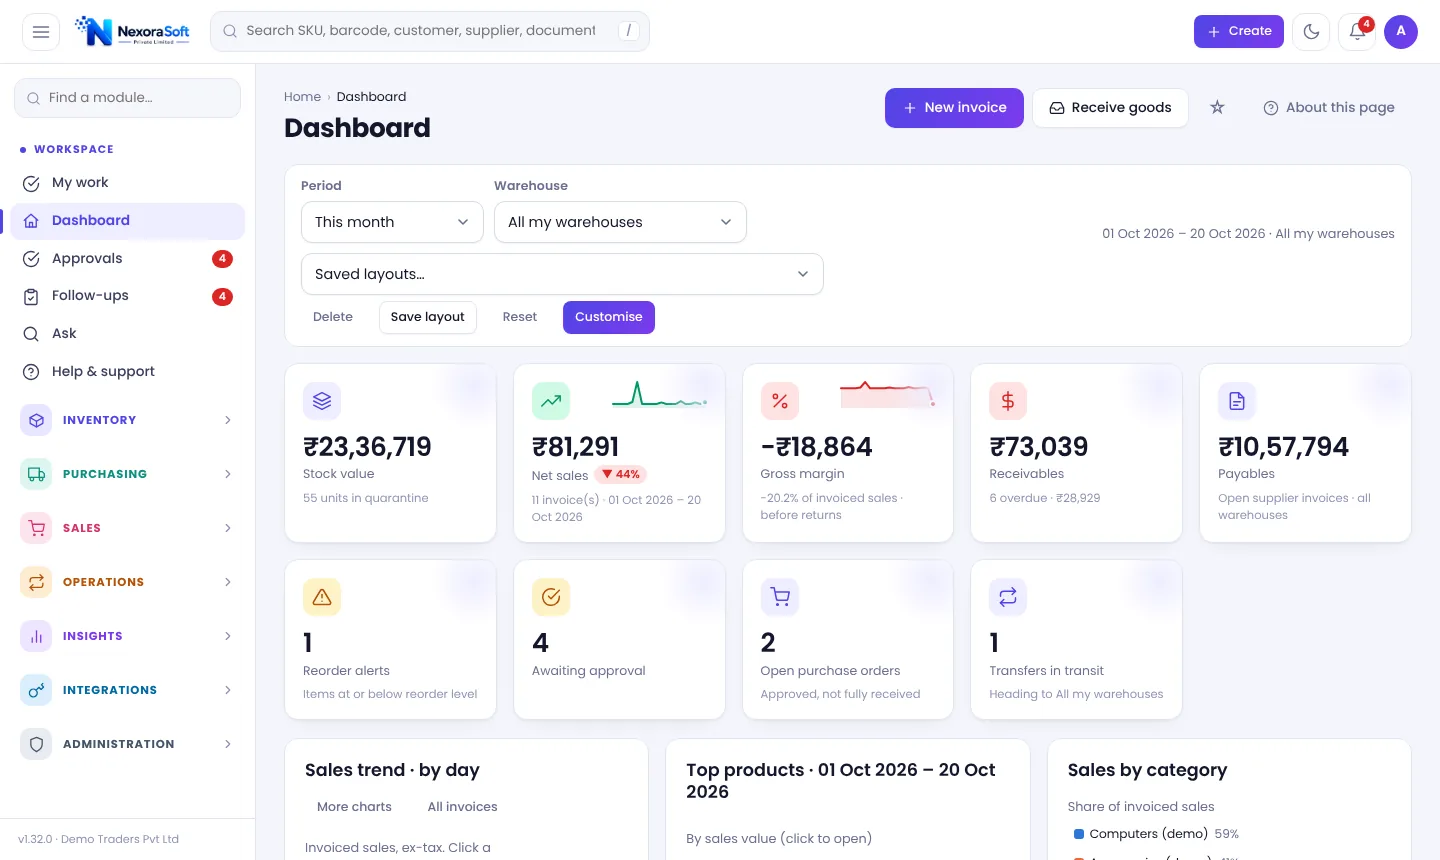
Inventory health shows money in non-moving, excess and dead stock, the days limits you set and a health score per product. Gross margin and stock value appear on the dashboard. See inventory analytics software and dead stock.
Related guides: Inventory Management Software in India (complete guide)
Stock Management SoftwareReorder Point & Replenishment SoftwareInventory Analytics & ABC AnalysisHow to Calculate Reorder PointABC Analysis in InventoryDead Stock and Slow-Moving Inventory
See NexoraIMS in Action
Book a free live demo and see stock, purchasing, GST billing and reports run on your own products.
Book a Free Demo +91 98115 51004