The hospital KPIs worth a place on the first screen, with the formula for each, why ICU needs its own occupancy view and how to turn an attention list into daily action.
Start With Today, Not the Month
Hospital owners already get monthly MIS reports. A dashboard has a different job: it tells the administrator what to act on before the day goes wrong. That changes which numbers earn a place on the first screen.
The Core Hospital Dashboard KPIs
| KPI | How to calculate it | Why it matters |
|---|---|---|
| OPD footfall | Count of OPD visits in the period | Shows demand and the effect of doctor schedules and campaigns. |
| IPD admissions | Count of admissions in the period | Drives bed planning and revenue. |
| Bed occupancy rate | Inpatient days divided by (available beds x days in period), as a percentage | Too low wastes capacity, too high risks refusing admissions, especially in ICU. |
| Average length of stay | Total inpatient days of discharged patients divided by number of discharges | Rising stay without a case-mix reason points to delays in care or discharge. |
| Bed turnover | Discharges divided by available beds | Shows how many patients each bed serves in the period. |
| Pending bills | Total unpaid amount and count older than 7 days | The quickest cash lever; ageing shows where billing stalls. |
| Discharges awaiting billing | Patients medically discharged whose final bill is not settled | Beds blocked by paperwork and patient dissatisfaction at the counter. |
| Revenue by department | Collection split by OPD, IPD, pharmacy and lab | Shows which service lines carry the hospital. |
Bed Occupancy Needs Two Views
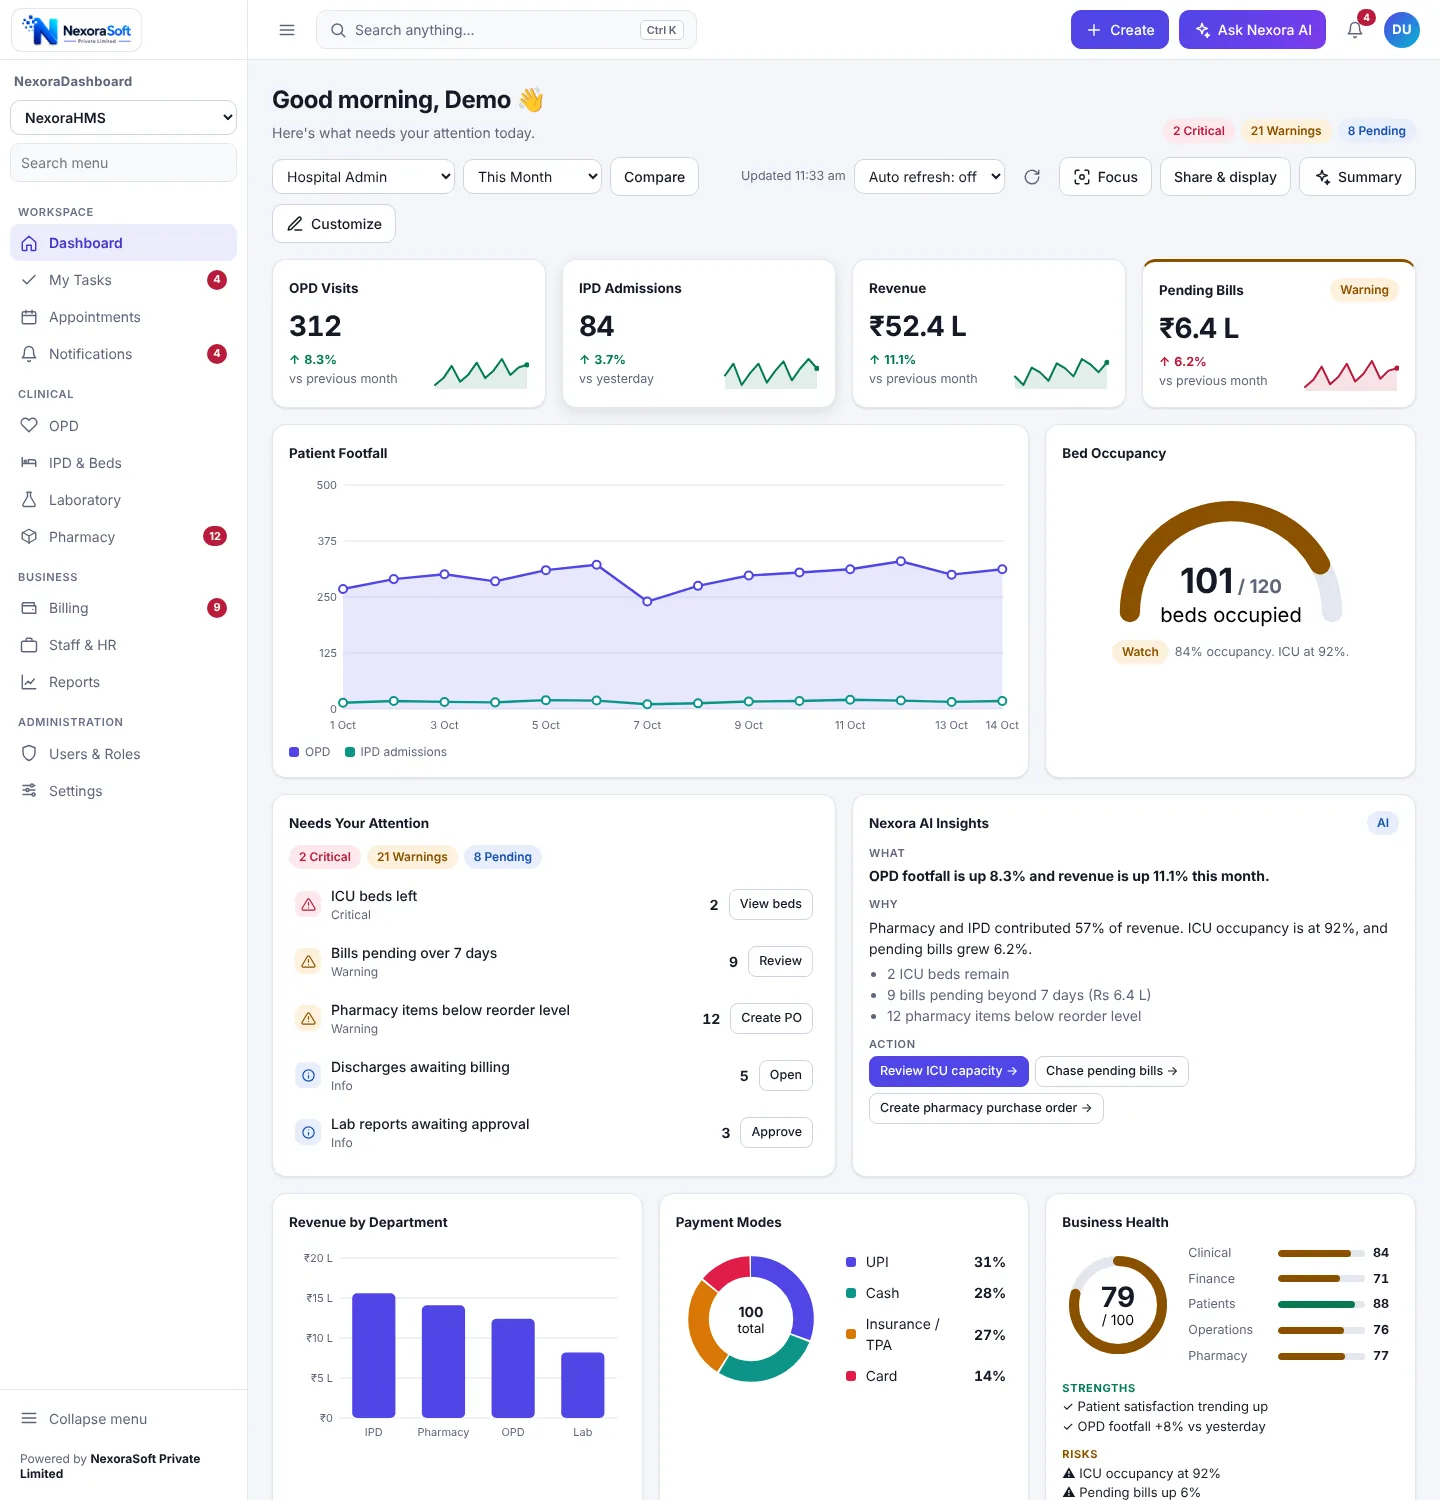
One overall percentage hides the problem. A hospital at 84 percent overall can still have its ICU at 92 percent and no bed for an emergency. Show overall occupancy and ICU or ward-wise occupancy side by side, with a watch status that turns amber before the unit is full.
Make the Attention List Do the Work
The most useful block for an administrator is a short list: ICU beds left, bills pending over 7 days, pharmacy items below reorder level, discharges waiting for billing, lab reports awaiting approval. Each row needs a count and a button that opens the right screen. If staff must hunt for the screen, the list loses its value.
Note: The numbers above are examples from a sample hospital. Thresholds such as how full is too full should be set by your clinical leadership, not copied from another hospital.
Dashboard or MIS Report?
Use the dashboard to decide today and the MIS report to review the month. They read the same data, so build the dashboard on top of the reporting you already trust. If you are still defining reports, start with our guide to hospital MIS reports and KPIs.
Who Should See What
An owner wants collection and occupancy, a nursing superintendent wants beds and discharges, a billing head wants pending bills and ageing, and a pharmacy in-charge wants reorder levels. Role-based templates let each person open a dashboard that matches their job. See our role-based dashboard guide.
See It Running
Our hospital dashboard software shows these widgets ready to connect to NexoraHMS or your existing hospital database.
Hospital Dashboard SoftwareHospital MIS ReportsBed Management SoftwareHospital MIS Reports and KPIs
Get a Hospital Dashboard Built Around Your KPIs
Free consultation, no commitment. We usually reply within 24 hours.
Book a Free Demo +91 98115 51004