Executive Dashboard Software for Owners, CEOs & Managers
See the whole business in one minute: a business health score, an attention list of what needs a decision, insights that say what changed and why, and answers in plain words. Built into NexoraDashboard and available on phone, desktop and meeting screens.
Business Health scoreNeeds Your Attention listWhat, why, action insightsAsk Nexora AIManagement summaryPresentation mode
Four Things an Executive Dashboard Should Answer
What needs me today?
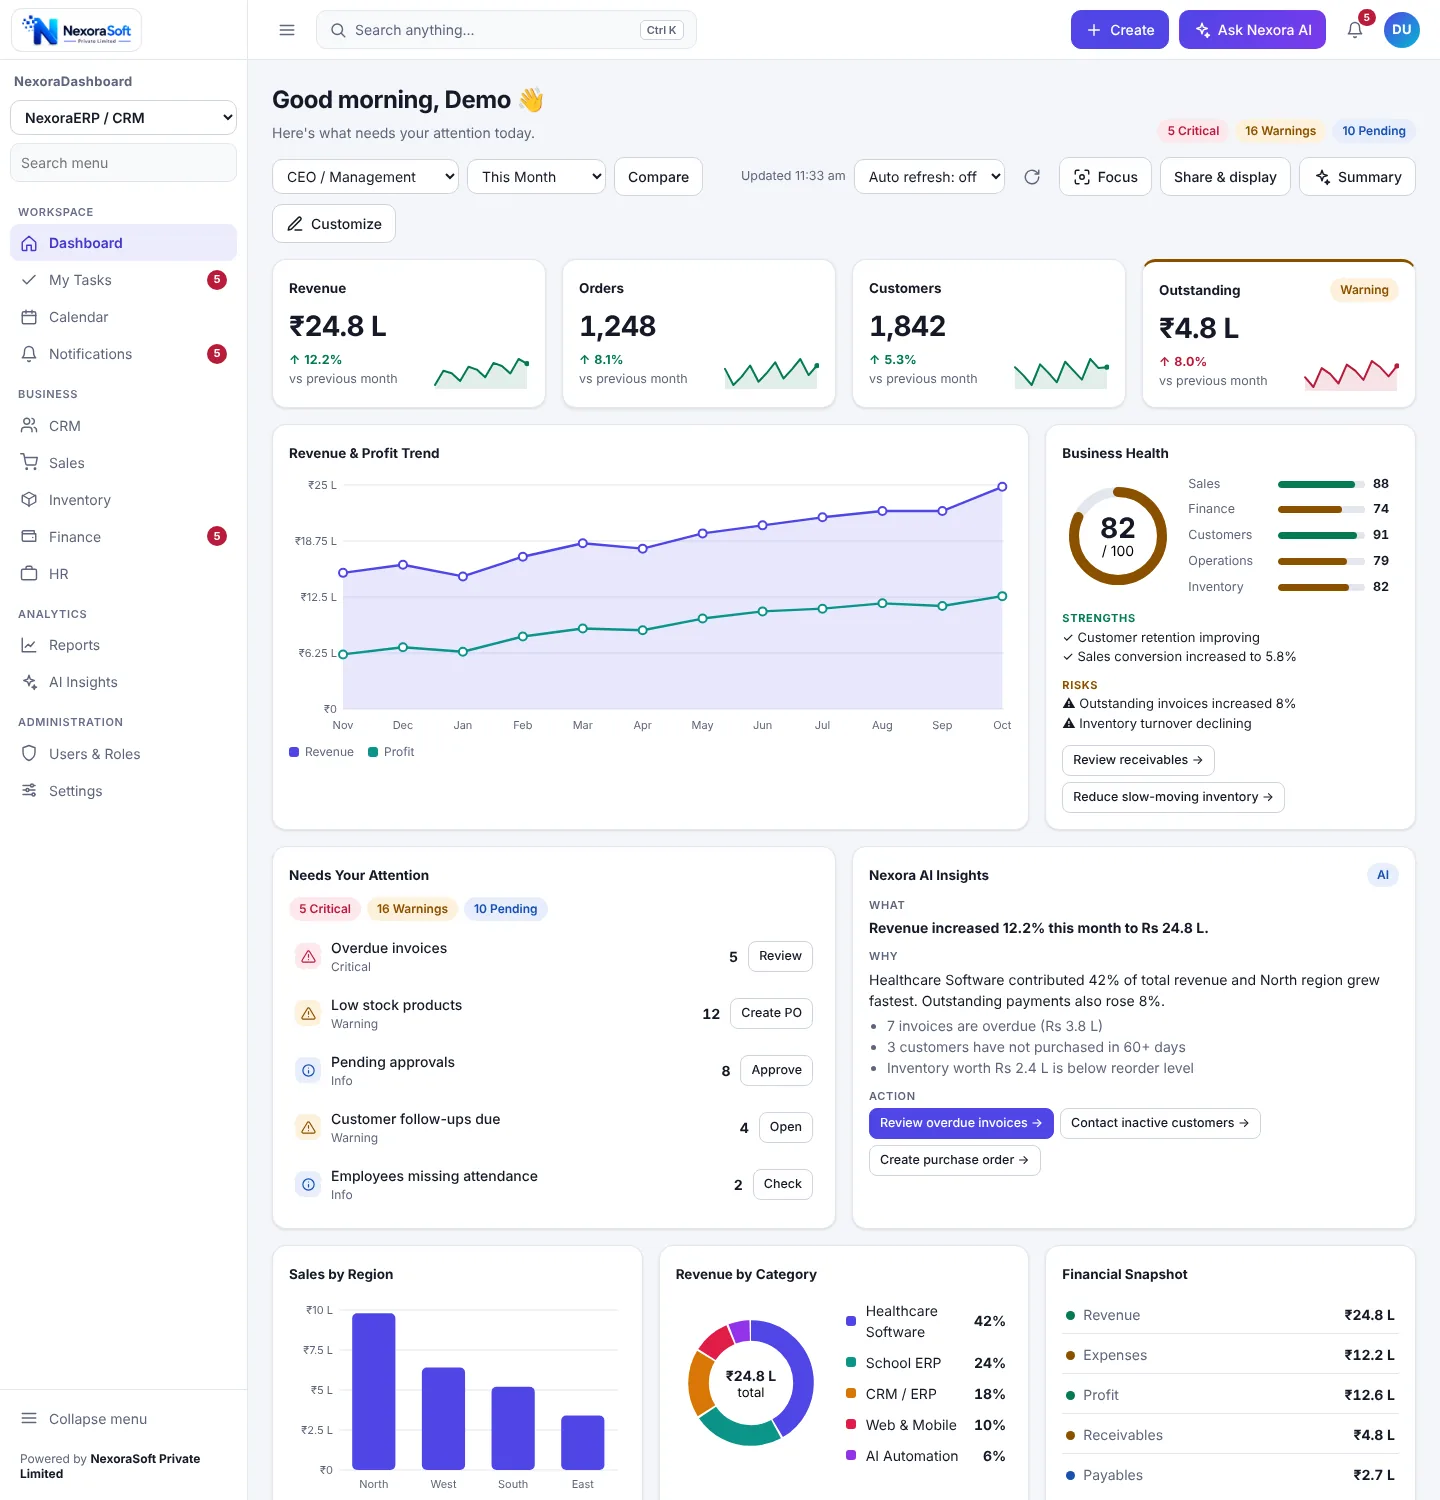
The Needs Your Attention list ranks critical, warning and pending items such as overdue invoices, low stock or approvals waiting, each with an action button.
How healthy is the business?
The Business Health score shows 0 to 100 with strengths and risks across sales, finance, customers, operations and inventory.
What changed and why?
Insights explain a movement in three parts: what happened, why, and the action to take next.
Where are we heading?
KPI cards with trend lines and a revenue and profit chart show direction, not just position.
Ask Nexora AI: Questions Answered From Your Data
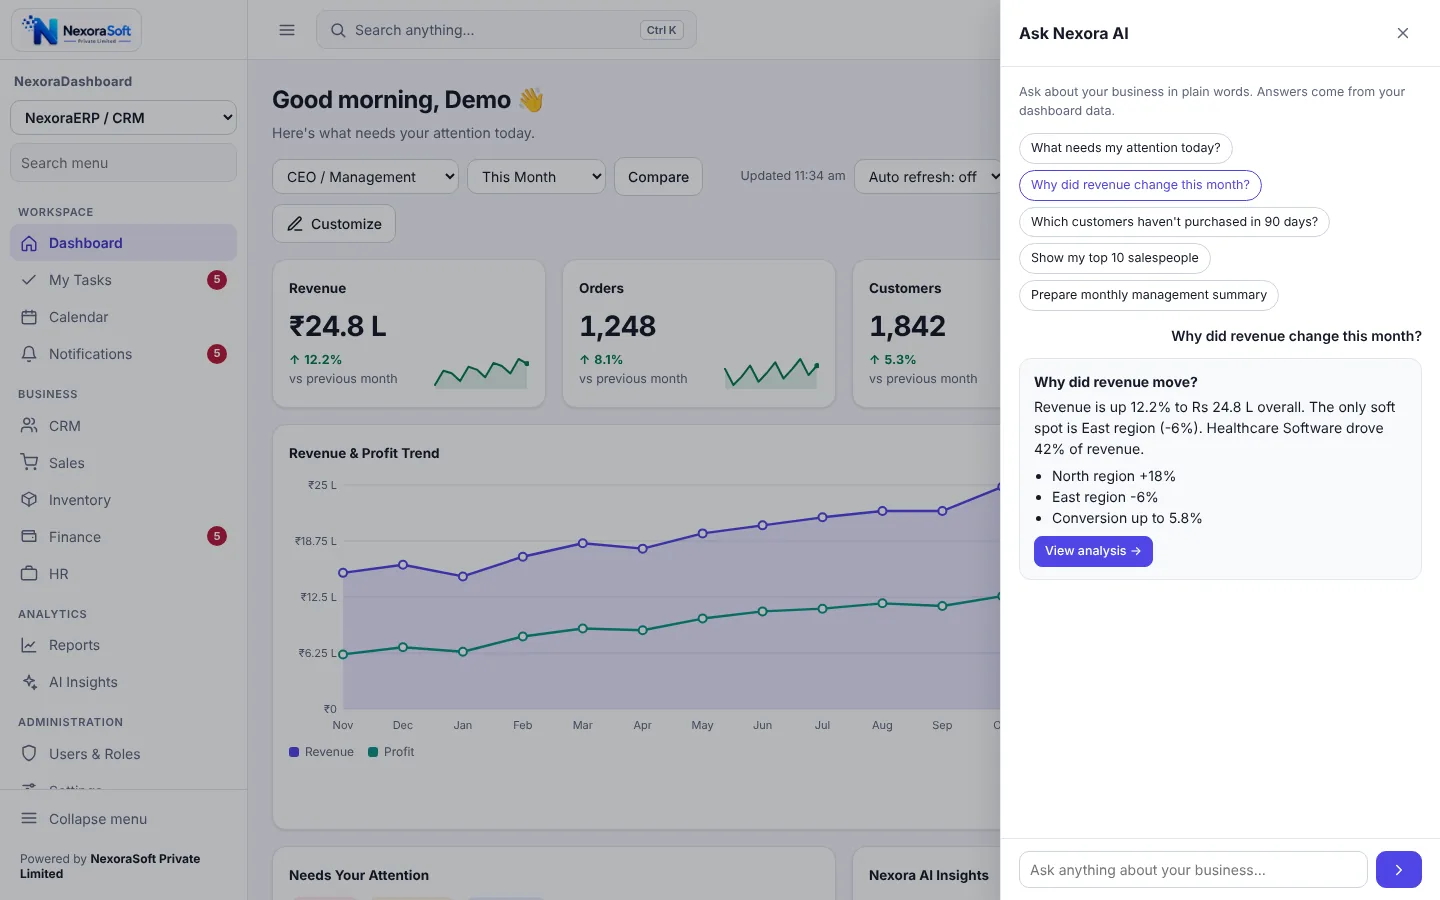
Type a question or pick a suggestion. The answer comes from the dashboard data and ends with a button to open the analysis.
Owners rarely want another report. They want an answer. The question panel offers suggestions such as these and accepts your own words.
- What needs my attention today?
- Why did revenue change this month?
- Which customers have not purchased in 90 days?
- Show my top 10 salespeople
- Prepare monthly management summary
Answers are drawn from your stored dashboard data. Connecting an external language model is optional and scoped separately.
Summary, Presentation Mode and Privacy Mode
Features for the moment an owner shows the dashboard to someone else.
| Feature | What it does |
|---|---|
| Management summary | Opens key points and recommended actions from the dashboard, with a Copy button to paste into an email or report. |
| Presentation mode | A clean full-screen view for meetings. |
| Wallboard mode | A large, always-on display for control rooms and operations floors. |
| Privacy mode | Masks amounts so a screen can be shared without showing figures. |
| Print and PDF | Prints the dashboard or saves it as PDF; tables export to CSV. |
| Focus mode | Removes distractions to concentrate on the numbers. |
Executive View and Role-Based Access
The CEO and Management view is one of several role templates, so each manager gets their own cut.
| Role | Typical focus |
|---|---|
| Admin or CEO | Whole-business KPIs, health score, attention list and insights. |
| Finance Manager | Revenue, expenses, profit, outstanding and overdue invoices. |
| Sales Manager | Orders, funnel, region and category sales, leaderboard and follow-ups. |
| Operations or IT | Operational alerts, stock, approvals and system status. |
| Staff | Own tasks, calendar and the few widgets they need. |
Permissions are enforced on the server as well as in the screen. Read more in role-based dashboards.
See Your Business on One Screen
Tell us your system and the questions you ask every morning. We will show an executive dashboard built around them.
Frequently Asked Questions
An executive dashboard is a single screen for owners, CEOs and senior managers that shows how the business is doing and what needs a decision. NexoraDashboard's executive view combines KPI cards, an attention list, insights and a health score.
A greeting, a count of critical items, warnings and pending approvals, then the main KPI cards. Below them are the revenue and profit trend, the Business Health score, a Needs Your Attention list and insights that explain what changed.
A 0 to 100 score with strengths, risks and suggested actions across areas such as sales, finance, customers, operations and inventory. It gives an owner one number to watch and the reasons behind it.
Each insight has three parts: what happened, why it happened and what to do next. For example, revenue up 12.2 percent, driven by one region, with buttons such as Review overdue invoices. The text is generated from your dashboard data.
Yes. The Ask Nexora AI panel answers questions such as what needs my attention today or why revenue changed this month, using your dashboard data, and offers a button to open the analysis. Connecting an external language model is optional and scoped separately.
Yes. The Summary button opens a management summary with key points and recommended actions that you can copy, and the screen can be printed or saved as PDF. Presentation mode and privacy mode help when you show the dashboard in a meeting.
Yes. On a phone the dashboard becomes stacked cards with bottom navigation for Home, Tasks, Alerts, Search and More, so an owner can check the business without a laptop.
No. Power BI is for analysts exploring data. An executive dashboard is for people who need to see what to act on today without building a report. See our guide on custom dashboards versus Power BI for when to use each.