Home › Products › NexoraUNMS › Network Device Dashboard & Fault Advisor
NexoraUNMS · FeatureNetwork Device Dashboard and Fault Advisor
When a switch misbehaves, engineers normally open five screens: CPU, ports, errors, VLANs and power. NexoraUNMS puts them on one device overview dashboard: CPU and memory gauges, uptime, ports up, ping quality and a physical-ports table with live rates.
CPU and RAM gaugesPhysical ports tableVLAN and bridge tablesWAN interface trafficPoE power
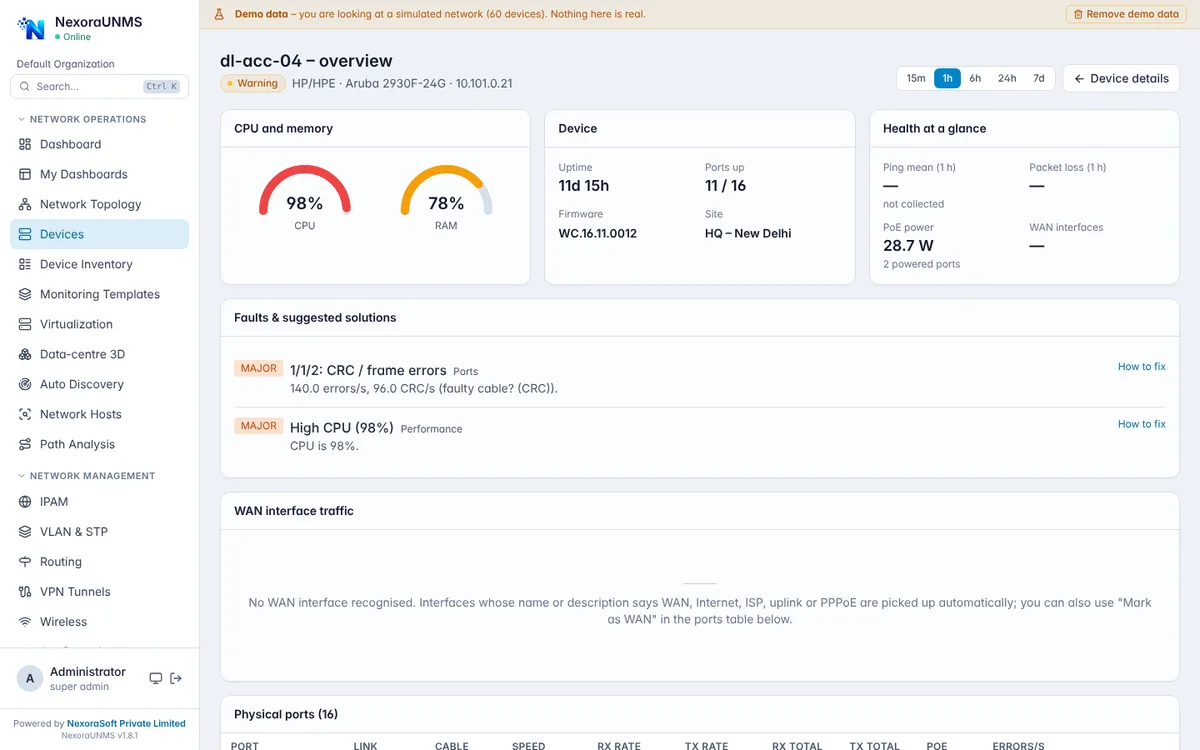
Real NexoraUNMS screens captured with built-in demo data (simulated network).
What Is Network Device Dashboard & Fault Advisor?
When a switch misbehaves, engineers normally open five screens: CPU, ports, errors, VLANs and power. NexoraUNMS puts them on one device overview dashboard: CPU and memory gauges, uptime, ports up, ping quality and a physical-ports table with live rates.
A Fault Advisor reads the live data and lists what is wrong, with probable causes, steps to check and vendor commands. It is rule-based, not machine learning, so every suggestion traces back to a reading such as 140 errors a second on a port or 98% CPU.
This capability is part of NexoraUNMS, so it shares one device inventory, one alert system and one login with monitoring, topology, configuration and reports.
What You Get
CPU and RAM gauges
Live CPU and memory with uptime, firmware, site and ports up on one card.
Physical ports table
Link state, cable plugged, live RX/TX rate, totals and error rate per port, in natural port order, with per-port graphs.
VLAN and bridge tables
VLANs sorted by ID with per-VLAN traffic graphs, plus bridge information.
WAN interface traffic
Interfaces named WAN, Internet, ISP, uplink or PPPoE are picked up automatically, or mark one as WAN yourself. Rate and cumulative bytes are shown.
PoE power
Power budget and powered ports; per-port PoE power is read for MikroTik today.
Ping quality
Round-trip best, mean, worst and standard deviation, plus packet loss, from 10 pings a minute kept for 30 days.
Fault Advisor
Faults from live data: offline root cause, CPU, memory, port errors, duplex, saturation, link down, PoE, temperature, fans, optics, disk, UPS, jitter and loss.
Device inventory
The whole fleet in one table with CPU and RAM gauges, uptime, ports, alerts and site, with search, filter and sort.
How It Works
Open a device
Pick a device from the inventory or an alert and choose Overview dashboard.
Read the gauges and faults
See what is outside normal range and how severe it is.
Open "How to fix"
Each finding lists probable causes, steps to check and vendor commands.
Compare time ranges
Switch between 15 minutes, 1 hour, 6 hours, 24 hours and 7 days.
What to Know
The Fault Advisor is rule-based and works from the data a device exposes, so a fault that the device does not report cannot be advised on. Per-port PoE power needs vendor support (MikroTik today; other vendors show the PoE budget). Ping statistics are measured from the monitoring server, so devices polled only through a remote agent do not have them. Screens shown use built-in demo data.
Frequently Asked Questions
A per-device list of faults found from live data, each with probable causes, steps to check and vendor commands. It is rule-based, so each suggestion can be traced to a reading.
Offline devices with root cause, high CPU and memory, port errors, duplex problems, saturated or down links, PoE issues, temperature, fans, optics, disk, UPS, jitter and packet loss.
Yes. VLAN and bridge tables are sorted by VLAN ID with per-VLAN graphs. PoE shows the power budget, and per-port power for MikroTik.
Yes. The Device Inventory page lists every device with CPU and RAM gauges, uptime, ports, alerts and site, with search, status filter and sorting.
Talk to Us About NexoraUNMS
Tell us how many devices and sites you run and what you need to see or control, and get a free live demo of NexoraUNMS. No commitment; we typically respond within 24 hours.