Home › Products › NexoraUNMS › AI Network Monitoring & Root Cause Analysis
NexoraUNMS · FeatureAI Network Monitoring and Root Cause Analysis
AI in monitoring is only useful if it is honest about what it knows. NexoraUNMS uses statistical anomaly detection and trend prediction on your own history, rule-based root cause analysis on your topology, and an assistant that answers from your monitoring data.
Data-grounded assistantAnomaly detectionTrend predictionCapacity forecastRoot cause analysis
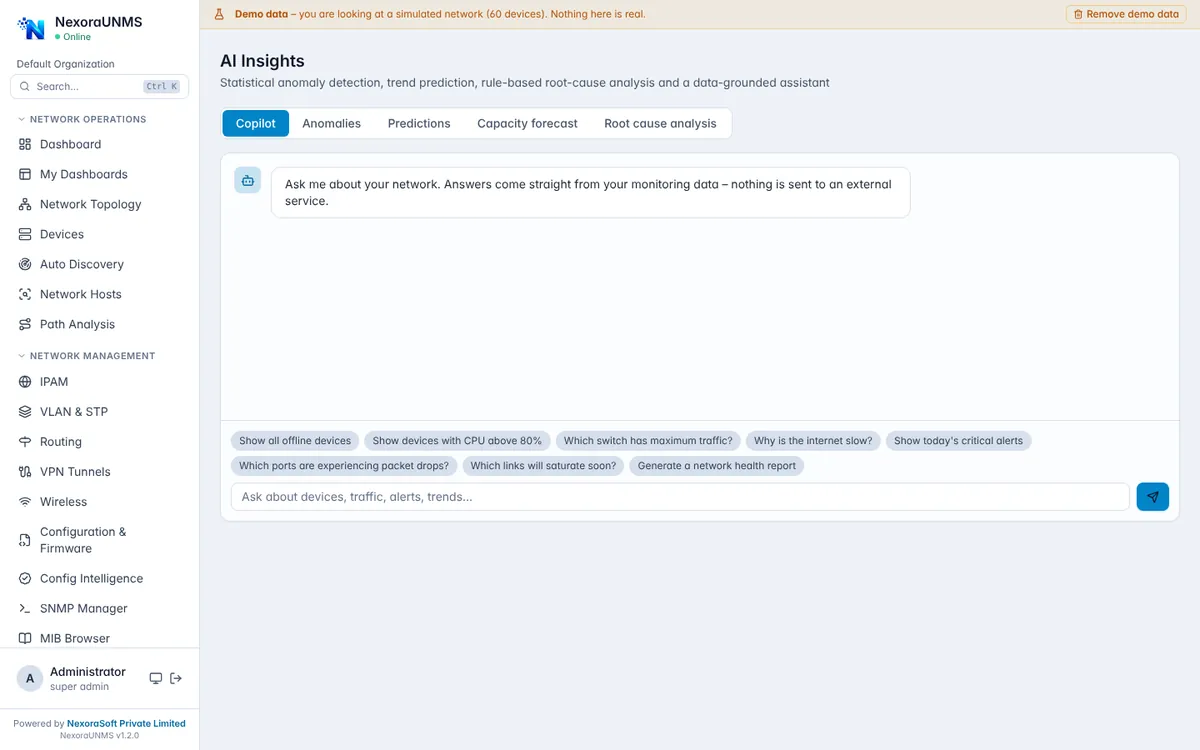
Real NexoraUNMS screens captured with built-in demo data (simulated network).
What Is AI Network Monitoring & Root Cause Analysis?
AI in monitoring is only useful if it is honest about what it knows. NexoraUNMS uses statistical anomaly detection and trend prediction on your own history, rule-based root cause analysis on your topology, and an assistant that answers from your monitoring data.
Questions like "which devices have CPU above 80%", "why is the Delhi site slow" or "which links will run out of capacity" are answered from stored data. The assistant runs inside the application and, as the screen states, nothing is sent to an external service.
This capability is part of NexoraUNMS, so it shares one device inventory, one alert system and one login with monitoring, topology, configuration and reports.
What You Get
Data-grounded assistant
Ask about devices, alerts and traffic in plain language.
Anomaly detection
Statistical detection of values that depart from normal.
Trend prediction
Forecast metrics from history.
Capacity forecast
Warn before links and disks fill.
Root cause analysis
Rule-based cause finding using topology.
Stays on your server
No monitoring data is sent to an outside AI service.
How It Works
Collect history
Monitoring builds a baseline.
Detect
Anomalies and trends appear.
Ask
Query the assistant.
Act
Open a ticket or run path analysis.
New in NexoraUNMS 1.8: Anomaly Models and Fault Advice
Ten statistical detectors
Robust z-score, EWMA, CUSUM, two seasonal profiles, Holt forecast, rate of change, percentile band, trend residual and isolation forest vote per metric; four or more agreeing is reported as an anomaly.
Fault Advisor
A rule-based list of faults per device with probable causes, steps and vendor commands.
Capacity forecast and what-if
30, 60 and 90-day forecasts and growth tests for links and disks.
Assistant proposes, people approve
The natural-language assistant can only propose changes; a different administrator approves, then the change-control engine runs them.
Prometheus endpoint
Send network metrics to your own Prometheus and Grafana with an API token.
Behaviour baselines
Median and MAD per time profile flag values that are unusual for that hour and weekday.
These are classic statistical methods, not trained machine-learning models, and they need a few weeks of history. See capacity forecast and anomaly detection.
What to Know
Predictions and anomalies need history, so they improve after a few weeks of data. Answers are limited to what is in your monitoring database.
Frequently Asked Questions
No. The assistant answers from your monitoring data and nothing is sent to an external service.
It uses topology and alert rules to find the upstream cause of a group of alerts.
Usually a few weeks of history gives a meaningful baseline.
No. Assistant answers are read-only; changes use guarded, audited actions.
Talk to Us About NexoraUNMS
Tell us how many devices and sites you run and what you need to see or control, and get a free live demo of NexoraUNMS. No commitment; we typically respond within 24 hours.